29
/fr/
fr
AIzaSyAYiBZKx7MnpbEhh9jyipgxe19OcubqV5w
April 1, 2024
122851
Dominican Republic
DOM
true
2
1
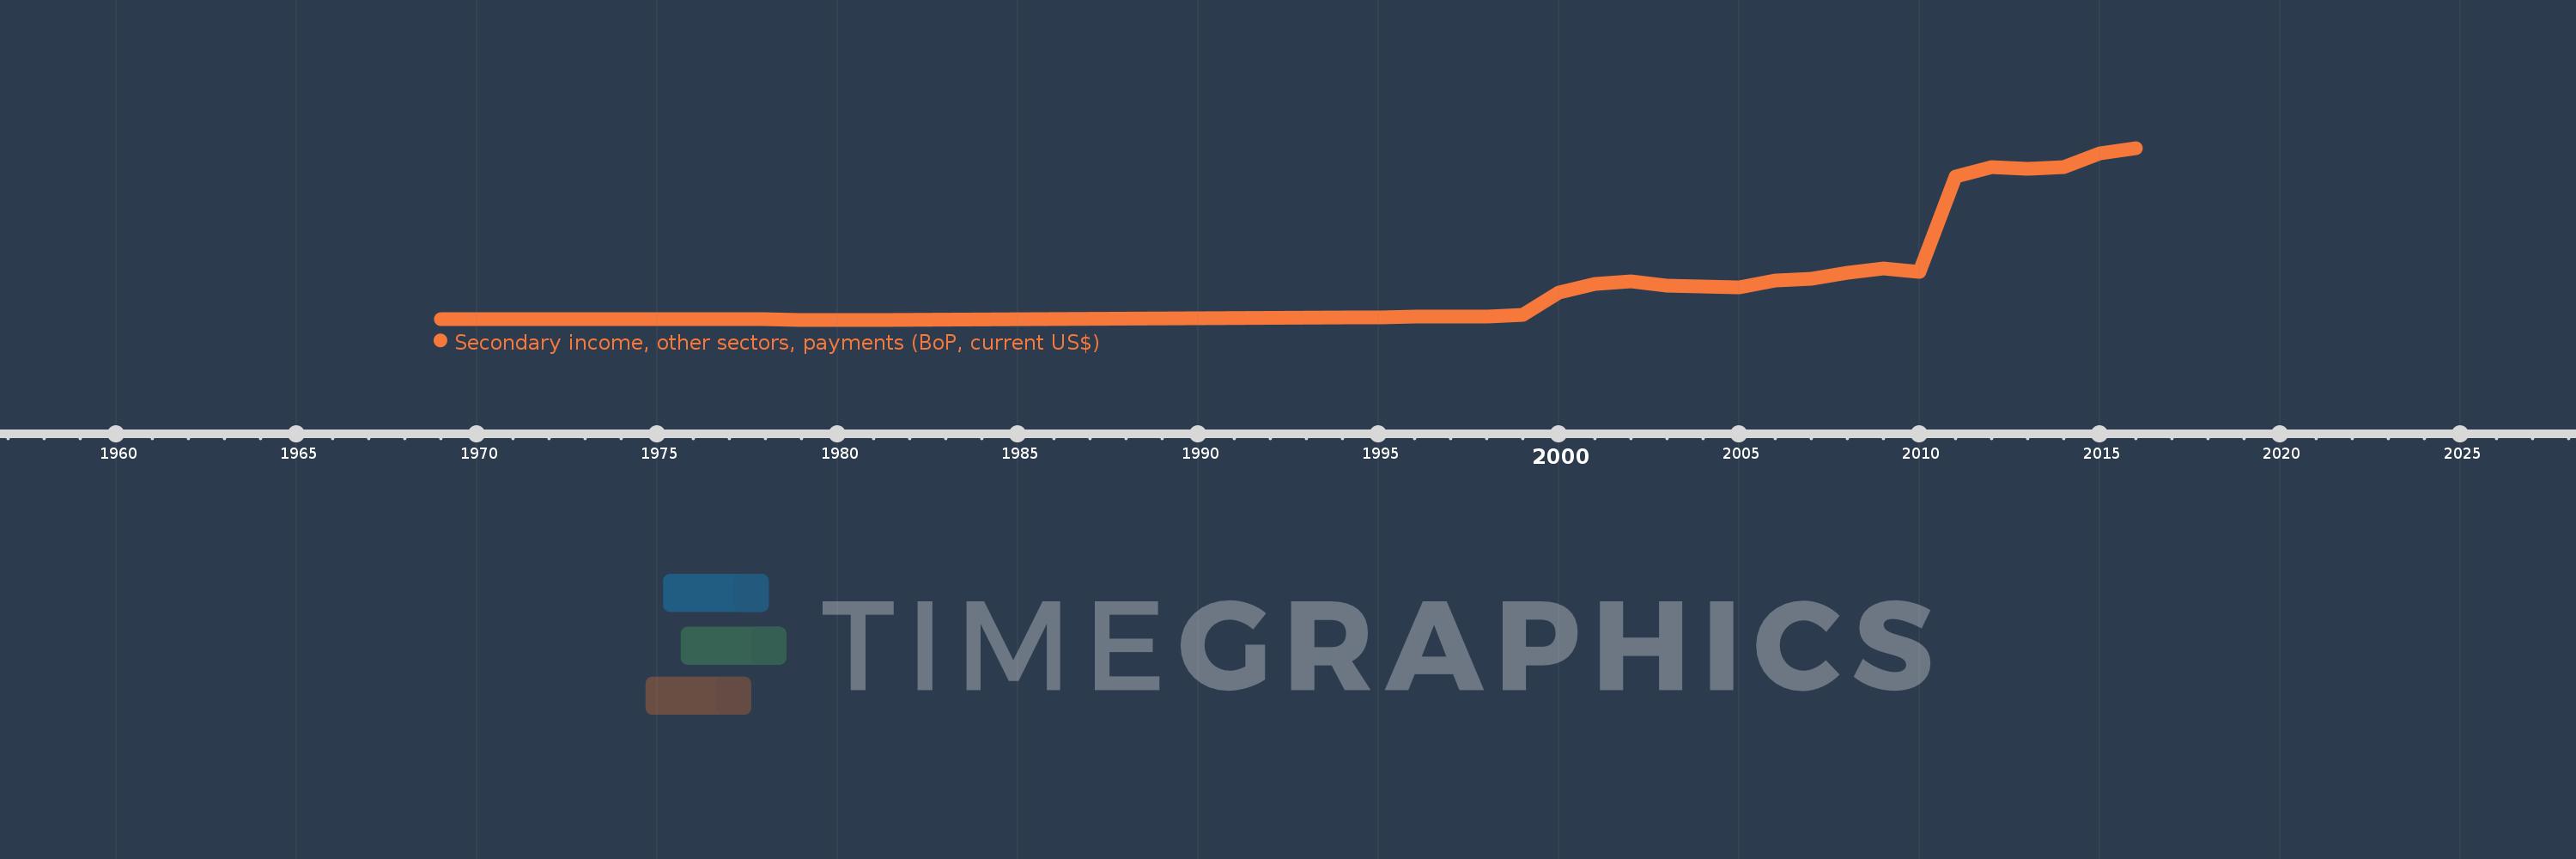
Secondary income, other sectors, payments (BoP, current US$)
2016,2015,2014,2013,2012,2011,2010,2009,2008,2007,2006,2005,2004,2003,2002,2001,2000,1999,1998,1997,1996,1995,1994,1981,1980,1979,1978,1977,1976,1975,1974,1973,1972,1971,1970,1969
Cette statistique dans les autres pays:
AfghanistanAlbaniaAlgeriaAngolaAntigua and BarbudaArab WorldArgentinaArmeniaArubaAustraliaAustriaAzerbaijanBahamas, TheBahrainBangladeshBarbadosBelarusBelgiumBelizeBeninBermudaBhutanBoliviaBosnia and HerzegovinaBotswanaBrazilBrunei DarussalamBulgariaBurkina FasoBurundiCabo VerdeCambodiaCameroonCanadaCaribbean small statesCentral African RepublicCentral Europe and the BalticsChadChileChinaColombiaComorosCongo, Dem. Rep.Congo, Rep.Costa RicaCote d'IvoireCroatiaCuracaoCyprusCzech RepublicDenmarkDjiboutiDominicaDominican RepublicEarly-demographic dividendEast Asia & PacificEast Asia & Pacific (excluding high income)East Asia & Pacific (IDA & IBRD countries)EcuadorEgypt, Arab Rep.El SalvadorEquatorial GuineaEritreaEstoniaEthiopiaEuro areaEurope & Central AsiaEurope & Central Asia (excluding high income)Europe & Central Asia (IDA & IBRD countries)European UnionFaroe IslandsFijiFinlandFragile and conflict affected situationsFranceFrench PolynesiaGabonGambia, TheGeorgiaGermanyGhanaGreeceGrenadaGuatemalaGuineaGuinea-BissauGuyanaHaitiHeavily indebted poor countries (HIPC)High incomeHondurasHong Kong SAR, ChinaHungaryIBRD onlyIcelandIDA & IBRD totalIDA blendIDA onlyIDA totalIndiaIndonesiaIran, Islamic Rep.IraqIrelandIsraelItalyJamaicaJapanJordanKazakhstanKenyaKiribatiKorea, Rep.KosovoKuwaitKyrgyz RepublicLao PDRLate-demographic dividendLatin America & Caribbean Latin America & Caribbean (excluding high income)Latin America & the Caribbean (IDA & IBRD countries)LatviaLeast developed countries: UN classificationLebanonLesothoLiberiaLibyaLithuaniaLow & middle incomeLow incomeLower middle incomeLuxembourgMacao SAR, ChinaMacedonia, FYRMadagascarMalawiMalaysiaMaldivesMaliMaltaMarshall IslandsMauritaniaMauritiusMexicoMicronesia, Fed. Sts.Middle East & North AfricaMiddle East & North Africa (excluding high income)Middle East & North Africa (IDA & IBRD countries)Middle incomeMoldovaMongoliaMontenegroMoroccoMozambiqueMyanmarNamibiaNepalNetherlandsNew CaledoniaNew ZealandNicaraguaNigerNigeriaNorth AmericaNorwayOECD membersOmanOther small statesPacific island small statesPakistanPalauPanamaPapua New GuineaParaguayPhilippinesPolandPortugalPost-demographic dividendPre-demographic dividendQatarRomaniaRussian FederationRwandaSamoaSao Tome and PrincipeSaudi ArabiaSenegalSerbiaSeychellesSierra LeoneSingaporeSint Maarten (Dutch part)Slovak RepublicSloveniaSmall statesSolomon IslandsSouth AfricaSouth AsiaSouth Asia (IDA & IBRD)South SudanSpainSri LankaSt. Kitts and NevisSt. LuciaSt. Vincent and the GrenadinesSub-Saharan Africa Sub-Saharan Africa (excluding high income)Sub-Saharan Africa (IDA & IBRD countries)SudanSurinameSwazilandSwedenSwitzerlandSyrian Arab RepublicTajikistanTanzaniaThailandTimor-LesteTogoTongaTrinidad and TobagoTunisiaTurkeyTuvaluUgandaUkraineUnited KingdomUnited StatesUpper middle incomeUruguayVanuatuVenezuela, RBVietnamWest Bank and GazaWorldYemen, Rep.ZambiaZimbabwe La ligne de temps
Cette échelle de temps montre un graphique de 1969 année à 2016 année Dominican Republic. Les données jusqu'à 1968 année ne sont pas présentés. Quantité d'observations actuelles selon dates: 36.
Source (désignation):
Les indicateurs du développement mondiale
Source (organisation):
International Monetary Fund, Balance of Payments Statistics Yearbook and data files.
Catégories:
Economy & Growth
Dernière mise à jour
23 avr. 2017
Les indicateurs de changement de valeurs selon les années
Minimum:
300.0 milles
1 janv. 1979
Maximum:
909.0 mln.
1 janv. 2016
Pour la date d''observation
Valeur
Changement absolu
Le changement par rapport à la valeur précédente
1 janv. 1969
4.0 mln.
+4.0 mln.
0.0%
1 janv. 1970
2.3 mln.
-1.7 mln.
-42.5%
1 janv. 1971
3.0 mln.
+700.0 milles
30.43%
1 janv. 1972
3.0 mln.
0.0
0.0%
1 janv. 1973
3.0 mln.
0.0
0.0%
1 janv. 1974
3.2 mln.
+200.0 milles
6.67%
1 janv. 1975
2.5 mln.
-700.0 milles
-21.88%
1 janv. 1976
1.8 mln.
-700.0 milles
-28.0%
1 janv. 1977
1.3 mln.
-500.0 milles
-27.78%
1 janv. 1978
1.5 mln.
+200.0 milles
15.38%
1 janv. 1979
300.0 milles
-1.2 mln.
-80.0%
1 janv. 1980
300.0 milles
0.0
0.0%
1 janv. 1981
300.0 milles
0.0
0.0%
1 janv. 1994
13.0 mln.
+12.7 mln.
4.23 milles%
1 janv. 1995
14.0 mln.
+1000.0 milles
7.69%
1 janv. 1996
15.3 mln.
+1.3 mln.
9.29%
1 janv. 1997
16.7 mln.
+1.4 mln.
9.15%
1 janv. 1998
18.2 mln.
+1.5 mln.
8.98%
1 janv. 1999
27.4 mln.
+9.2 mln.
50.55%
1 janv. 2000
146.2 mln.
+118.8 mln.
433.58%
1 janv. 2001
190.5 mln.
+44.3 mln.
30.3%
1 janv. 2002
202.0 mln.
+11.5 mln.
6.04%
1 janv. 2003
179.9 mln.
-22.1 mln.
-10.94%
1 janv. 2004
173.9 mln.
-6.0 mln.
-3.34%
1 janv. 2005
171.4 mln.
-2.5 mln.
-1.44%
1 janv. 2006
207.9 mln.
+36.5 mln.
21.3%
1 janv. 2007
219.0 mln.
+11.1 mln.
5.34%
1 janv. 2008
251.1 mln.
+32.1 mln.
14.66%
1 janv. 2009
270.0 mln.
+18.9 mln.
7.53%
1 janv. 2010
253.0 mln.
-17.0 mln.
-6.3%
1 janv. 2011
758.2 mln.
+505.2 mln.
199.68%
1 janv. 2012
808.7 mln.
+50.5 mln.
6.66%
1 janv. 2013
800.8 mln.
-7.9 mln.
-0.98%
1 janv. 2014
808.9 mln.
+8.1 mln.
1.01%
1 janv. 2015
880.9 mln.
+72.0 mln.
8.9%
1 janv. 2016
909.0 mln.
+28.1 mln.
3.19%
Classement des pays selon les statistiques actuelles par années


Commentaires: