29
/fr/
fr
AIzaSyAYiBZKx7MnpbEhh9jyipgxe19OcubqV5w
April 1, 2024
153999
Iceland
ISL
true
2
1
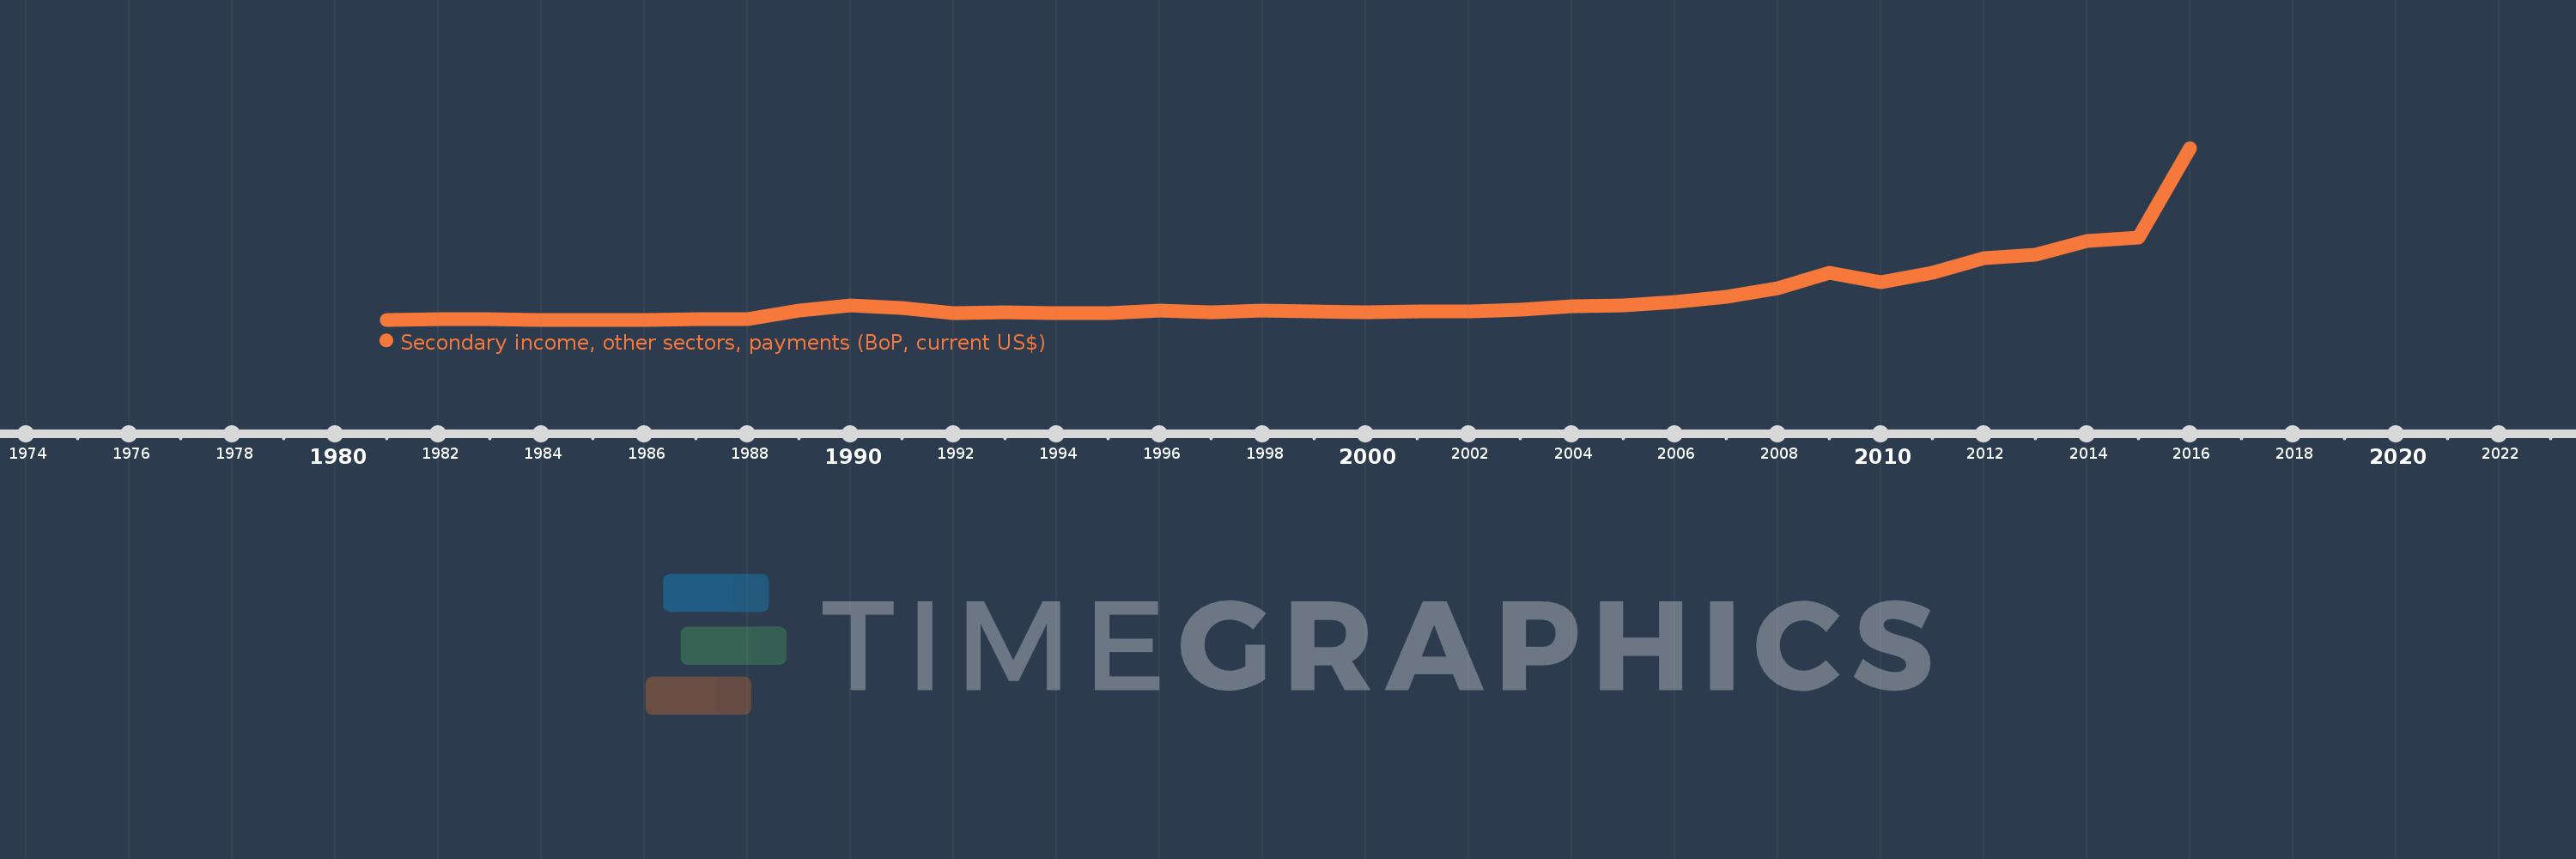
Secondary income, other sectors, payments (BoP, current US$)
2016,2015,2014,2013,2012,2011,2010,2009,2008,2007,2006,2005,2004,2003,2002,2001,2000,1999,1998,1997,1996,1995,1994,1993,1992,1991,1990,1989,1988,1987,1986,1985,1984,1983,1982,1981
Cette statistique dans les autres pays:
AfghanistanAlbaniaAlgeriaAngolaAntigua and BarbudaArab WorldArgentinaArmeniaArubaAustraliaAustriaAzerbaijanBahamas, TheBahrainBangladeshBarbadosBelarusBelgiumBelizeBeninBermudaBhutanBoliviaBosnia and HerzegovinaBotswanaBrazilBrunei DarussalamBulgariaBurkina FasoBurundiCabo VerdeCambodiaCameroonCanadaCaribbean small statesCentral African RepublicCentral Europe and the BalticsChadChileChinaColombiaComorosCongo, Dem. Rep.Congo, Rep.Costa RicaCote d'IvoireCroatiaCuracaoCyprusCzech RepublicDenmarkDjiboutiDominicaDominican RepublicEarly-demographic dividendEast Asia & PacificEast Asia & Pacific (excluding high income)East Asia & Pacific (IDA & IBRD countries)EcuadorEgypt, Arab Rep.El SalvadorEquatorial GuineaEritreaEstoniaEthiopiaEuro areaEurope & Central AsiaEurope & Central Asia (excluding high income)Europe & Central Asia (IDA & IBRD countries)European UnionFaroe IslandsFijiFinlandFragile and conflict affected situationsFranceFrench PolynesiaGabonGambia, TheGeorgiaGermanyGhanaGreeceGrenadaGuatemalaGuineaGuinea-BissauGuyanaHaitiHeavily indebted poor countries (HIPC)High incomeHondurasHong Kong SAR, ChinaHungaryIBRD onlyIcelandIDA & IBRD totalIDA blendIDA onlyIDA totalIndiaIndonesiaIran, Islamic Rep.IraqIrelandIsraelItalyJamaicaJapanJordanKazakhstanKenyaKiribatiKorea, Rep.KosovoKuwaitKyrgyz RepublicLao PDRLate-demographic dividendLatin America & Caribbean Latin America & Caribbean (excluding high income)Latin America & the Caribbean (IDA & IBRD countries)LatviaLeast developed countries: UN classificationLebanonLesothoLiberiaLibyaLithuaniaLow & middle incomeLow incomeLower middle incomeLuxembourgMacao SAR, ChinaMacedonia, FYRMadagascarMalawiMalaysiaMaldivesMaliMaltaMarshall IslandsMauritaniaMauritiusMexicoMicronesia, Fed. Sts.Middle East & North AfricaMiddle East & North Africa (excluding high income)Middle East & North Africa (IDA & IBRD countries)Middle incomeMoldovaMongoliaMontenegroMoroccoMozambiqueMyanmarNamibiaNepalNetherlandsNew CaledoniaNew ZealandNicaraguaNigerNigeriaNorth AmericaNorwayOECD membersOmanOther small statesPacific island small statesPakistanPalauPanamaPapua New GuineaParaguayPhilippinesPolandPortugalPost-demographic dividendPre-demographic dividendQatarRomaniaRussian FederationRwandaSamoaSao Tome and PrincipeSaudi ArabiaSenegalSerbiaSeychellesSierra LeoneSingaporeSint Maarten (Dutch part)Slovak RepublicSloveniaSmall statesSolomon IslandsSouth AfricaSouth AsiaSouth Asia (IDA & IBRD)South SudanSpainSri LankaSt. Kitts and NevisSt. LuciaSt. Vincent and the GrenadinesSub-Saharan Africa Sub-Saharan Africa (excluding high income)Sub-Saharan Africa (IDA & IBRD countries)SudanSurinameSwazilandSwedenSwitzerlandSyrian Arab RepublicTajikistanTanzaniaThailandTimor-LesteTogoTongaTrinidad and TobagoTunisiaTurkeyTuvaluUgandaUkraineUnited KingdomUnited StatesUpper middle incomeUruguayVanuatuVenezuela, RBVietnamWest Bank and GazaWorldYemen, Rep.ZambiaZimbabwe La ligne de temps
Cette échelle de temps montre un graphique de 1981 année à 2016 année Iceland. Les données jusqu'à 1980 année ne sont pas présentés. Quantité d'observations actuelles selon dates: 36.
Source (désignation):
Les indicateurs du développement mondiale
Source (organisation):
International Monetary Fund, Balance of Payments Statistics Yearbook and data files.
Catégories:
Economy & Growth
Dernière mise à jour
23 avr. 2017
Les indicateurs de changement de valeurs selon les années
Minimum:
1.2 mln.
1 janv. 1981
Maximum:
317.659 mln.
1 janv. 2016
Pour la date d''observation
Valeur
Changement absolu
Le changement par rapport à la valeur précédente
1 janv. 1981
1.2 mln.
+1.2 mln.
0.0%
1 janv. 1982
2.3 mln.
+1.1 mln.
91.67%
1 janv. 1983
1.9 mln.
-400.0 milles
-17.39%
1 janv. 1984
1.2 mln.
-700.0 milles
-36.84%
1 janv. 1985
1.2 mln.
0.0
0.0%
1 janv. 1986
1.2 mln.
0.0
0.0%
1 janv. 1987
1.6 mln.
+400.0 milles
33.33%
1 janv. 1988
2.9 mln.
+1.3 mln.
81.25%
1 janv. 1989
18.0 mln.
+15.1 mln.
520.69%
1 janv. 1990
27.7 mln.
+9.7 mln.
53.89%
1 janv. 1991
22.569 mln.
-5.131 mln.
-18.52%
1 janv. 1992
13.968 mln.
-8.602 mln.
-38.11%
1 janv. 1993
14.543 mln.
+575.532 milles
4.12%
1 janv. 1994
12.788 mln.
-1.755 mln.
-12.07%
1 janv. 1995
13.878 mln.
+1.09 mln.
8.52%
1 janv. 1996
18.144 mln.
+4.266 mln.
30.74%
1 janv. 1997
15.271 mln.
-2.873 mln.
-15.83%
1 janv. 1998
18.182 mln.
+2.911 mln.
19.06%
1 janv. 1999
16.675 mln.
-1.507 mln.
-8.29%
1 janv. 2000
14.617 mln.
-2.058 mln.
-12.34%
1 janv. 2001
16.175 mln.
+1.559 mln.
10.66%
1 janv. 2002
16.007 mln.
-168.189 milles
-1.04%
1 janv. 2003
19.647 mln.
+3.64 mln.
22.74%
1 janv. 2004
26.216 mln.
+6.569 mln.
33.44%
1 janv. 2005
27.384 mln.
+1.168 mln.
4.46%
1 janv. 2006
33.932 mln.
+6.547 mln.
23.91%
1 janv. 2007
43.205 mln.
+9.274 mln.
27.33%
1 janv. 2008
59.182 mln.
+15.976 mln.
36.98%
1 janv. 2009
87.733 mln.
+28.551 mln.
48.24%
1 janv. 2010
69.79 mln.
-17.943 mln.
-20.45%
1 janv. 2011
86.994 mln.
+17.204 mln.
24.65%
1 janv. 2012
114.558 mln.
+27.565 mln.
31.69%
1 janv. 2013
121.486 mln.
+6.928 mln.
6.05%
1 janv. 2014
145.88 mln.
+24.395 mln.
20.08%
1 janv. 2015
153.23 mln.
+7.35 mln.
5.04%
1 janv. 2016
317.659 mln.
+164.429 mln.
107.31%
Classement des pays selon les statistiques actuelles par années


Commentaires: