29
/fr/
fr
AIzaSyAYiBZKx7MnpbEhh9jyipgxe19OcubqV5w
April 1, 2024
133619
Finland
FIN
true
2
1
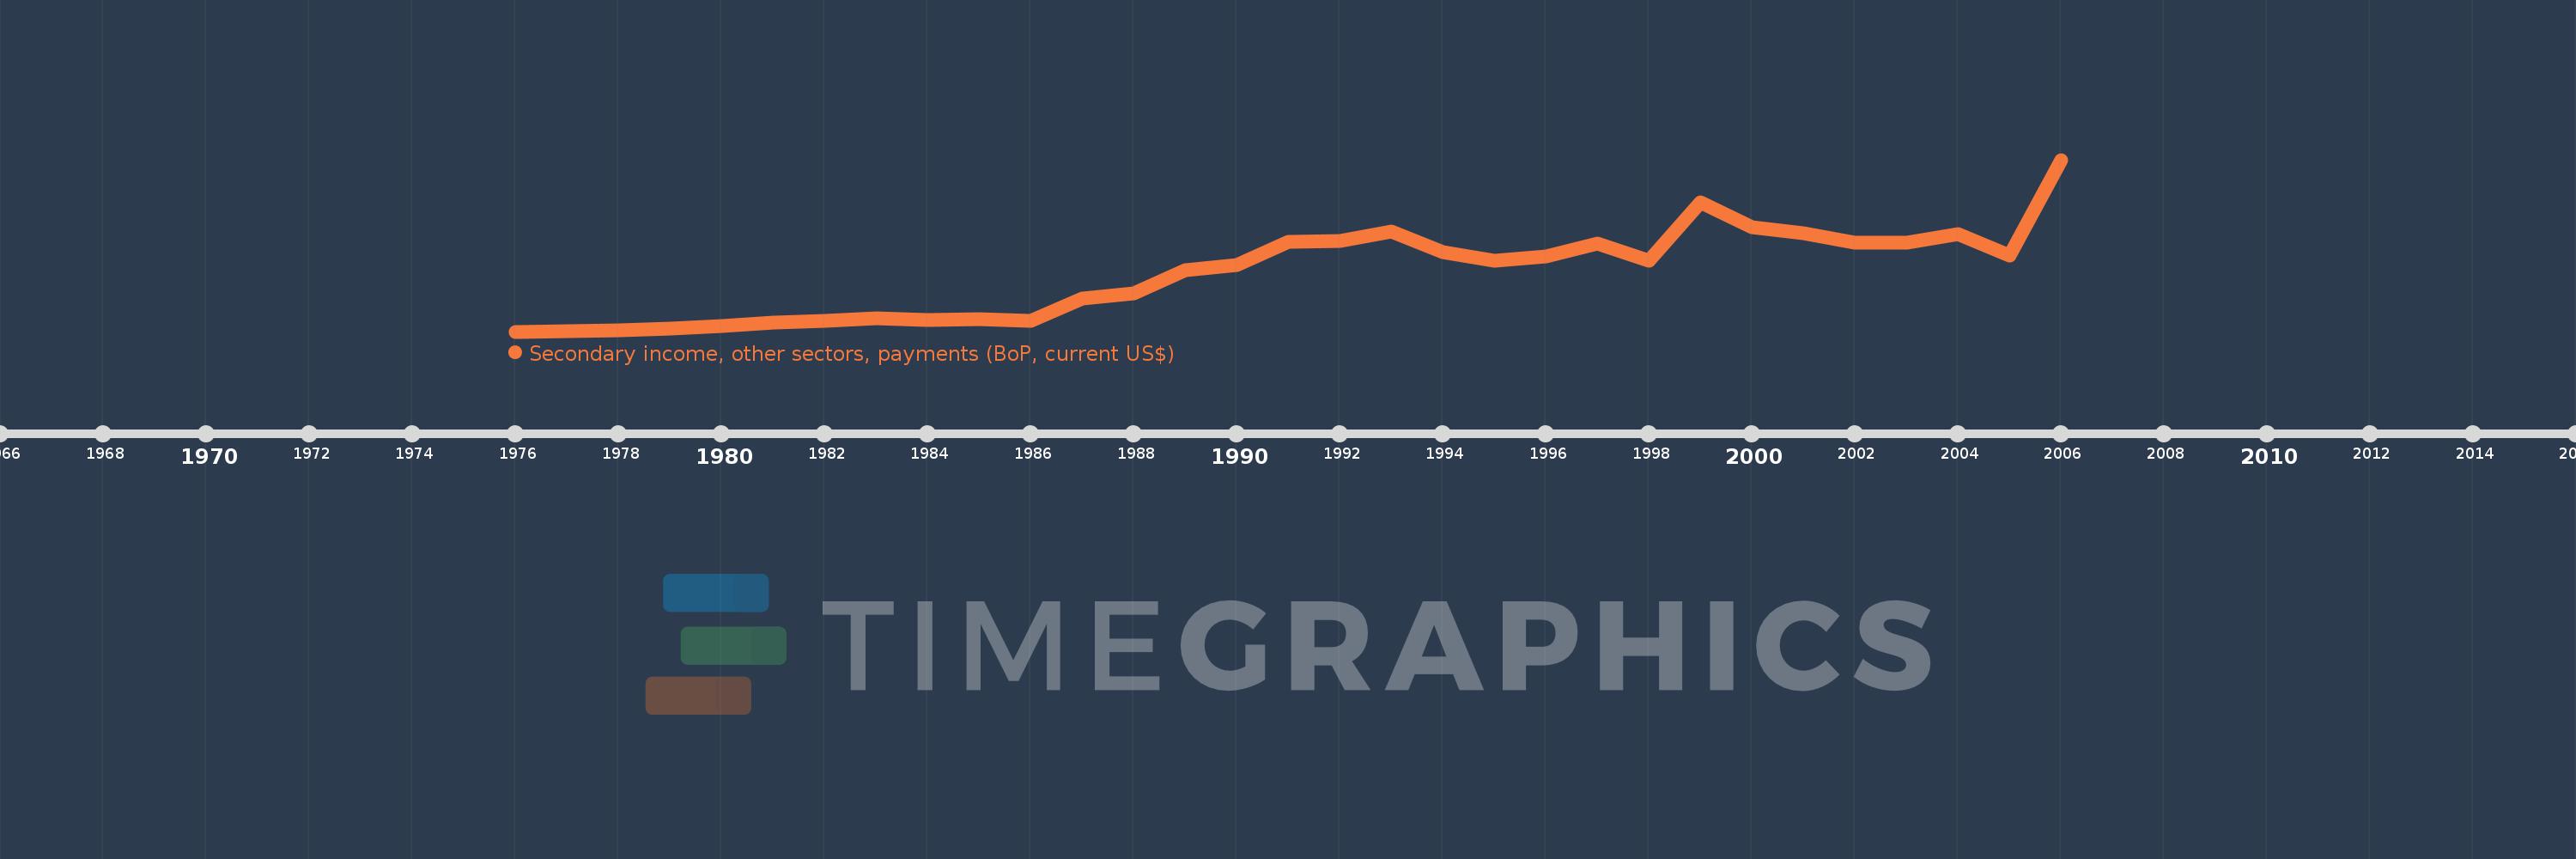
Secondary income, other sectors, payments (BoP, current US$)
2006,2005,2004,2003,2002,2001,2000,1999,1998,1997,1996,1995,1994,1993,1992,1991,1990,1989,1988,1987,1986,1985,1984,1983,1982,1981,1980,1979,1978,1977,1976
Cette statistique dans les autres pays:
AfghanistanAlbaniaAlgeriaAngolaAntigua and BarbudaArab WorldArgentinaArmeniaArubaAustraliaAustriaAzerbaijanBahamas, TheBahrainBangladeshBarbadosBelarusBelgiumBelizeBeninBermudaBhutanBoliviaBosnia and HerzegovinaBotswanaBrazilBrunei DarussalamBulgariaBurkina FasoBurundiCabo VerdeCambodiaCameroonCanadaCaribbean small statesCentral African RepublicCentral Europe and the BalticsChadChileChinaColombiaComorosCongo, Dem. Rep.Congo, Rep.Costa RicaCote d'IvoireCroatiaCuracaoCyprusCzech RepublicDenmarkDjiboutiDominicaDominican RepublicEarly-demographic dividendEast Asia & PacificEast Asia & Pacific (excluding high income)East Asia & Pacific (IDA & IBRD countries)EcuadorEgypt, Arab Rep.El SalvadorEquatorial GuineaEritreaEstoniaEthiopiaEuro areaEurope & Central AsiaEurope & Central Asia (excluding high income)Europe & Central Asia (IDA & IBRD countries)European UnionFaroe IslandsFijiFinlandFragile and conflict affected situationsFranceFrench PolynesiaGabonGambia, TheGeorgiaGermanyGhanaGreeceGrenadaGuatemalaGuineaGuinea-BissauGuyanaHaitiHeavily indebted poor countries (HIPC)High incomeHondurasHong Kong SAR, ChinaHungaryIBRD onlyIcelandIDA & IBRD totalIDA blendIDA onlyIDA totalIndiaIndonesiaIran, Islamic Rep.IraqIrelandIsraelItalyJamaicaJapanJordanKazakhstanKenyaKiribatiKorea, Rep.KosovoKuwaitKyrgyz RepublicLao PDRLate-demographic dividendLatin America & Caribbean Latin America & Caribbean (excluding high income)Latin America & the Caribbean (IDA & IBRD countries)LatviaLeast developed countries: UN classificationLebanonLesothoLiberiaLibyaLithuaniaLow & middle incomeLow incomeLower middle incomeLuxembourgMacao SAR, ChinaMacedonia, FYRMadagascarMalawiMalaysiaMaldivesMaliMaltaMarshall IslandsMauritaniaMauritiusMexicoMicronesia, Fed. Sts.Middle East & North AfricaMiddle East & North Africa (excluding high income)Middle East & North Africa (IDA & IBRD countries)Middle incomeMoldovaMongoliaMontenegroMoroccoMozambiqueMyanmarNamibiaNepalNetherlandsNew CaledoniaNew ZealandNicaraguaNigerNigeriaNorth AmericaNorwayOECD membersOmanOther small statesPacific island small statesPakistanPalauPanamaPapua New GuineaParaguayPhilippinesPolandPortugalPost-demographic dividendPre-demographic dividendQatarRomaniaRussian FederationRwandaSamoaSao Tome and PrincipeSaudi ArabiaSenegalSerbiaSeychellesSierra LeoneSingaporeSint Maarten (Dutch part)Slovak RepublicSloveniaSmall statesSolomon IslandsSouth AfricaSouth AsiaSouth Asia (IDA & IBRD)South SudanSpainSri LankaSt. Kitts and NevisSt. LuciaSt. Vincent and the GrenadinesSub-Saharan Africa Sub-Saharan Africa (excluding high income)Sub-Saharan Africa (IDA & IBRD countries)SudanSurinameSwazilandSwedenSwitzerlandSyrian Arab RepublicTajikistanTanzaniaThailandTimor-LesteTogoTongaTrinidad and TobagoTunisiaTurkeyTuvaluUgandaUkraineUnited KingdomUnited StatesUpper middle incomeUruguayVanuatuVenezuela, RBVietnamWest Bank and GazaWorldYemen, Rep.ZambiaZimbabwe La ligne de temps
Cette échelle de temps montre un graphique de 1976 année à 2006 année Finland. Les données jusqu'à 1975 année ne sont pas présentés. Quantité d'observations actuelles selon dates: 31.
Source (désignation):
Les indicateurs du développement mondiale
Source (organisation):
International Monetary Fund, Balance of Payments Statistics Yearbook and data files.
Catégories:
Economy & Growth
Dernière mise à jour
23 avr. 2017
Les indicateurs de changement de valeurs selon les années
Minimum:
27.979 mln.
1 janv. 1976
Maximum:
1.066 mds
1 janv. 2006
Pour la date d''observation
Valeur
Changement absolu
Le changement par rapport à la valeur précédente
1 janv. 1976
27.979 mln.
+27.979 mln.
0.0%
1 janv. 1977
32.612 mln.
+4.632 mln.
16.56%
1 janv. 1978
35.382 mln.
+2.77 mln.
8.5%
1 janv. 1979
46.312 mln.
+10.93 mln.
30.89%
1 janv. 1980
60.248 mln.
+13.936 mln.
30.09%
1 janv. 1981
80.51 mln.
+20.263 mln.
33.63%
1 janv. 1982
94.475 mln.
+13.965 mln.
17.35%
1 janv. 1983
107.555 mln.
+13.079 mln.
13.84%
1 janv. 1984
95.822 mln.
-11.733 mln.
-10.91%
1 janv. 1985
101.802 mln.
+5.98 mln.
6.24%
1 janv. 1986
92.385 mln.
-9.416 mln.
-9.25%
1 janv. 1987
229.694 mln.
+137.308 mln.
148.63%
1 janv. 1988
259.049 mln.
+29.356 mln.
12.78%
1 janv. 1989
401.611 mln.
+142.562 mln.
55.03%
1 janv. 1990
429.637 mln.
+28.026 mln.
6.98%
1 janv. 1991
569.856 mln.
+140.218 mln.
32.64%
1 janv. 1992
575.023 mln.
+5.167 mln.
0.91%
1 janv. 1993
632.293 mln.
+57.27 mln.
9.96%
1 janv. 1994
510.63 mln.
-121.663 mln.
-19.24%
1 janv. 1995
455.646 mln.
-54.984 mln.
-10.77%
1 janv. 1996
480.798 mln.
+25.152 mln.
5.52%
1 janv. 1997
561.472 mln.
+80.674 mln.
16.78%
1 janv. 1998
455.914 mln.
-105.558 mln.
-18.8%
1 janv. 1999
807.274 mln.
+351.36 mln.
77.07%
1 janv. 2000
661.154 mln.
-146.12 mln.
-18.1%
1 janv. 2001
620.463 mln.
-40.691 mln.
-6.15%
1 janv. 2002
565.77 mln.
-54.693 mln.
-8.81%
1 janv. 2003
567.24 mln.
+1.47 mln.
0.26%
1 janv. 2004
614.51 mln.
+47.27 mln.
8.33%
1 janv. 2005
489.184 mln.
-125.326 mln.
-20.39%
1 janv. 2006
1.066 mds
+576.802 mln.
117.91%
Classement des pays selon les statistiques actuelles par années


Commentaires: