29
/fr/
fr
AIzaSyAYiBZKx7MnpbEhh9jyipgxe19OcubqV5w
April 1, 2024
155320
India
IND
true
2
1
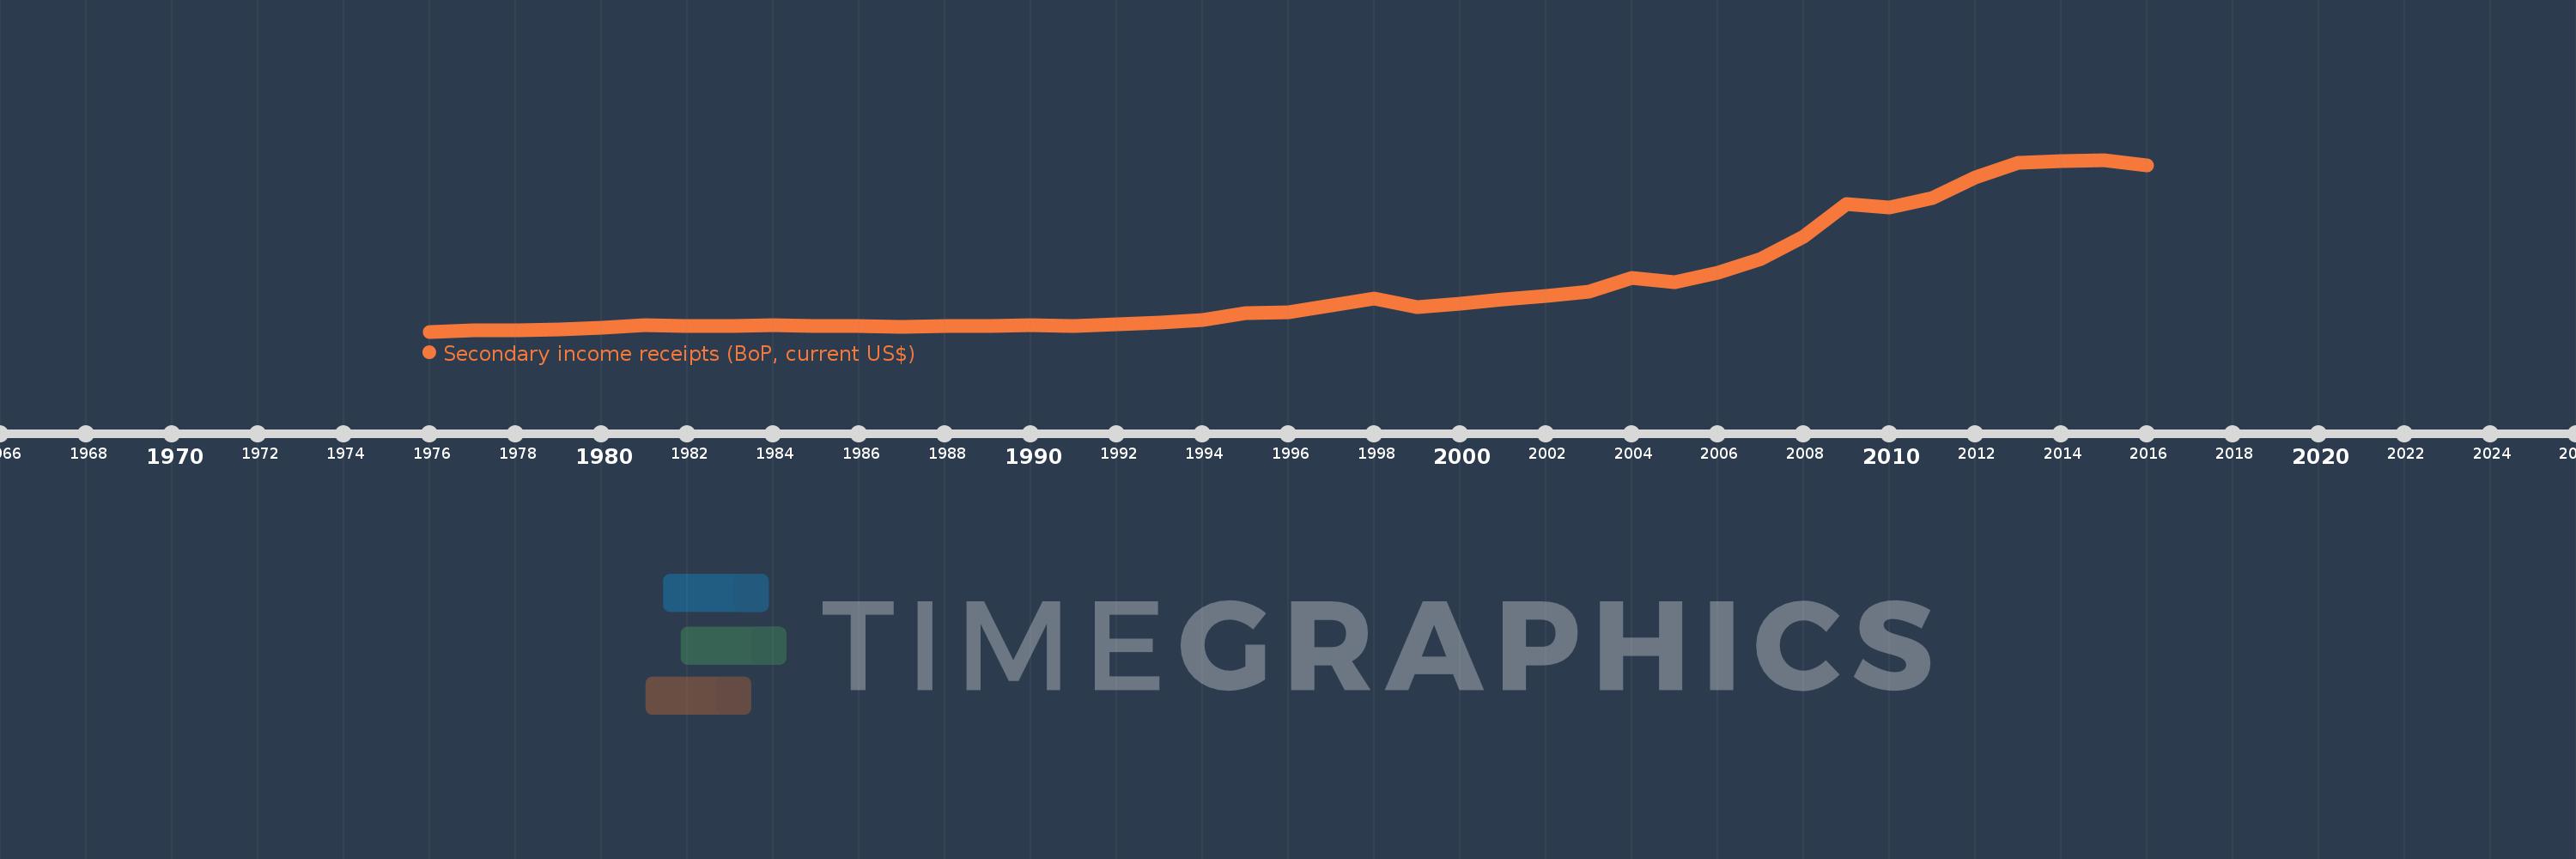
Secondary income receipts (BoP, current US$)
2016,2015,2014,2013,2012,2011,2010,2009,2008,2007,2006,2005,2004,2003,2002,2001,2000,1999,1998,1997,1996,1995,1994,1993,1992,1991,1990,1989,1988,1987,1986,1985,1984,1983,1982,1981,1980,1979,1978,1977,1976
Cette statistique dans les autres pays:
AfghanistanAlbaniaAlgeriaAngolaAntigua and BarbudaArab WorldArgentinaArmeniaArubaAustraliaAustriaAzerbaijanBahamas, TheBahrainBangladeshBarbadosBelarusBelgiumBelizeBeninBermudaBhutanBoliviaBosnia and HerzegovinaBotswanaBrazilBrunei DarussalamBulgariaBurkina FasoBurundiCabo VerdeCambodiaCameroonCanadaCaribbean small statesCentral African RepublicCentral Europe and the BalticsChadChileChinaColombiaComorosCongo, Dem. Rep.Congo, Rep.Costa RicaCote d'IvoireCroatiaCuracaoCyprusCzech RepublicDenmarkDjiboutiDominicaDominican RepublicEarly-demographic dividendEast Asia & PacificEast Asia & Pacific (excluding high income)East Asia & Pacific (IDA & IBRD countries)EcuadorEgypt, Arab Rep.El SalvadorEquatorial GuineaEritreaEstoniaEthiopiaEuro areaEurope & Central AsiaEurope & Central Asia (excluding high income)Europe & Central Asia (IDA & IBRD countries)European UnionFaroe IslandsFijiFinlandFragile and conflict affected situationsFranceFrench PolynesiaGabonGambia, TheGeorgiaGermanyGhanaGreeceGrenadaGuatemalaGuineaGuinea-BissauGuyanaHaitiHeavily indebted poor countries (HIPC)High incomeHondurasHong Kong SAR, ChinaHungaryIBRD onlyIcelandIDA & IBRD totalIDA blendIDA onlyIDA totalIndiaIndonesiaIran, Islamic Rep.IraqIrelandIsraelItalyJamaicaJapanJordanKazakhstanKenyaKiribatiKorea, Rep.KosovoKuwaitKyrgyz RepublicLao PDRLate-demographic dividendLatin America & Caribbean Latin America & Caribbean (excluding high income)Latin America & the Caribbean (IDA & IBRD countries)LatviaLeast developed countries: UN classificationLebanonLesothoLiberiaLibyaLithuaniaLow & middle incomeLow incomeLower middle incomeLuxembourgMacao SAR, ChinaMacedonia, FYRMadagascarMalawiMalaysiaMaldivesMaliMaltaMarshall IslandsMauritaniaMauritiusMexicoMicronesia, Fed. Sts.Middle East & North AfricaMiddle East & North Africa (excluding high income)Middle East & North Africa (IDA & IBRD countries)Middle incomeMoldovaMongoliaMontenegroMoroccoMozambiqueMyanmarNamibiaNepalNetherlandsNew CaledoniaNew ZealandNicaraguaNigerNigeriaNorth AmericaNorwayOECD membersOmanOther small statesPacific island small statesPakistanPalauPanamaPapua New GuineaParaguayPeruPhilippinesPolandPortugalPost-demographic dividendPre-demographic dividendQatarRomaniaRussian FederationRwandaSamoaSao Tome and PrincipeSaudi ArabiaSenegalSerbiaSeychellesSierra LeoneSingaporeSint Maarten (Dutch part)Slovak RepublicSloveniaSmall statesSolomon IslandsSouth AfricaSouth AsiaSouth Asia (IDA & IBRD)South SudanSpainSri LankaSt. Kitts and NevisSt. LuciaSt. Vincent and the GrenadinesSub-Saharan Africa Sub-Saharan Africa (excluding high income)Sub-Saharan Africa (IDA & IBRD countries)SudanSurinameSwazilandSwedenSwitzerlandSyrian Arab RepublicTajikistanTanzaniaThailandTimor-LesteTogoTongaTrinidad and TobagoTunisiaTurkeyTuvaluUgandaUkraineUnited KingdomUnited StatesUpper middle incomeUruguayVanuatuVenezuela, RBVietnamWest Bank and GazaWorldYemen, Rep.ZambiaZimbabwe La ligne de temps
Cette échelle de temps montre un graphique de 1976 année à 2016 année India. Les données jusqu'à 1975 année ne sont pas présentés. Quantité d'observations actuelles selon dates: 41.
Source (désignation):
Les indicateurs du développement mondiale
Source (organisation):
International Monetary Fund, Balance of Payments Statistics Yearbook and data files.
Catégories:
Economy & Growth
Dernière mise à jour
23 avr. 2017
Les indicateurs de changement de valeurs selon les années
Minimum:
635.684 mln.
1 janv. 1976
Maximum:
69.906 mds
1 janv. 2015
Pour la date d''observation
Valeur
Changement absolu
Le changement par rapport à la valeur précédente
1 janv. 1976
635.684 mln.
+635.684 mln.
0.0%
1 janv. 1977
1.052 mds
+415.939 mln.
65.43%
1 janv. 1978
1.317 mds
+265.811 mln.
25.28%
1 janv. 1979
1.647 mds
+329.248 mln.
24.99%
1 janv. 1980
2.068 mds
+420.876 mln.
25.56%
1 janv. 1981
3.347 mds
+1.28 mds
61.9%
1 janv. 1982
3.026 mds
-320.934 mln.
-9.59%
1 janv. 1983
2.939 mds
-87.365 mln.
-2.89%
1 janv. 1984
3.091 mds
+151.854 mln.
5.17%
1 janv. 1985
2.821 mds
-270.061 mln.
-8.74%
1 janv. 1986
2.835 mds
+14.48 mln.
0.51%
1 janv. 1987
2.668 mds
-167.016 mln.
-5.89%
1 janv. 1988
3.055 mds
+386.628 mln.
14.49%
1 janv. 1989
2.768 mds
-286.95 mln.
-9.39%
1 janv. 1990
3.106 mds
+338.118 mln.
12.21%
1 janv. 1991
2.854 mds
-252.67 mln.
-8.13%
1 janv. 1992
3.736 mds
+882.697 mln.
30.93%
1 janv. 1993
4.157 mds
+420.637 mln.
11.26%
1 janv. 1994
5.375 mds
+1.218 mds
29.31%
1 janv. 1995
8.208 mds
+2.833 mds
52.7%
1 janv. 1996
8.41 mds
+201.761 mln.
2.46%
1 janv. 1997
11.35 mds
+2.94 mds
34.96%
1 janv. 1998
13.975 mds
+2.626 mds
23.14%
1 janv. 1999
10.402 mds
-3.574 mds
-25.57%
1 janv. 2000
11.958 mds
+1.556 mds
14.96%
1 janv. 2001
13.548 mds
+1.59 mds
13.3%
1 janv. 2002
15.14 mds
+1.592 mds
11.75%
1 janv. 2003
16.788 mds
+1.648 mds
10.89%
1 janv. 2004
22.401 mds
+5.613 mds
33.43%
1 janv. 2005
20.615 mds
-1.787 mds
-7.98%
1 janv. 2006
24.512 mds
+3.897 mds
18.91%
1 janv. 2007
30.015 mds
+5.503 mds
22.45%
1 janv. 2008
38.885 mds
+8.87 mds
29.55%
1 janv. 2009
52.065 mds
+13.18 mds
33.89%
1 janv. 2010
50.526 mds
-1.539 mds
-2.96%
1 janv. 2011
54.38 mds
+3.853 mds
7.63%
1 janv. 2012
62.735 mds
+8.355 mds
15.36%
1 janv. 2013
68.611 mds
+5.876 mds
9.37%
1 janv. 2014
69.441 mds
+829.679 mln.
1.21%
1 janv. 2015
69.906 mds
+465.259 mln.
0.67%
1 janv. 2016
67.806 mds
-2.101 mds
-3.01%
Classement des pays selon les statistiques actuelles par années


Commentaires: