29
/fr/
fr
AIzaSyAYiBZKx7MnpbEhh9jyipgxe19OcubqV5w
April 1, 2024
112969
Costa Rica
CRI
true
2
1
Secondary income receipts (BoP, current US$)
2016,2015,2014,2013,2012,2011,2010,2009,2008,2007,2006,2005,2004,2003,2002,2001,2000,1999,1998,1997,1996,1995,1994,1993,1992,1991,1990,1989,1988,1987,1986,1985,1984,1983,1982,1981,1980,1979,1978
Cette statistique dans les autres pays:
AfghanistanAlbaniaAlgeriaAngolaAntigua and BarbudaArab WorldArgentinaArmeniaArubaAustraliaAustriaAzerbaijanBahamas, TheBahrainBangladeshBarbadosBelarusBelgiumBelizeBeninBermudaBhutanBoliviaBosnia and HerzegovinaBotswanaBrazilBrunei DarussalamBulgariaBurkina FasoBurundiCabo VerdeCambodiaCameroonCanadaCaribbean small statesCentral African RepublicCentral Europe and the BalticsChadChileChinaColombiaComorosCongo, Dem. Rep.Congo, Rep.Costa RicaCote d'IvoireCroatiaCuracaoCyprusCzech RepublicDenmarkDjiboutiDominicaDominican RepublicEarly-demographic dividendEast Asia & PacificEast Asia & Pacific (excluding high income)East Asia & Pacific (IDA & IBRD countries)EcuadorEgypt, Arab Rep.El SalvadorEquatorial GuineaEritreaEstoniaEthiopiaEuro areaEurope & Central AsiaEurope & Central Asia (excluding high income)Europe & Central Asia (IDA & IBRD countries)European UnionFaroe IslandsFijiFinlandFragile and conflict affected situationsFranceFrench PolynesiaGabonGambia, TheGeorgiaGermanyGhanaGreeceGrenadaGuatemalaGuineaGuinea-BissauGuyanaHaitiHeavily indebted poor countries (HIPC)High incomeHondurasHong Kong SAR, ChinaHungaryIBRD onlyIcelandIDA & IBRD totalIDA blendIDA onlyIDA totalIndiaIndonesiaIran, Islamic Rep.IraqIrelandIsraelItalyJamaicaJapanJordanKazakhstanKenyaKiribatiKorea, Rep.KosovoKuwaitKyrgyz RepublicLao PDRLate-demographic dividendLatin America & Caribbean Latin America & Caribbean (excluding high income)Latin America & the Caribbean (IDA & IBRD countries)LatviaLeast developed countries: UN classificationLebanonLesothoLiberiaLibyaLithuaniaLow & middle incomeLow incomeLower middle incomeLuxembourgMacao SAR, ChinaMacedonia, FYRMadagascarMalawiMalaysiaMaldivesMaliMaltaMarshall IslandsMauritaniaMauritiusMexicoMicronesia, Fed. Sts.Middle East & North AfricaMiddle East & North Africa (excluding high income)Middle East & North Africa (IDA & IBRD countries)Middle incomeMoldovaMongoliaMontenegroMoroccoMozambiqueMyanmarNamibiaNepalNetherlandsNew CaledoniaNew ZealandNicaraguaNigerNigeriaNorth AmericaNorwayOECD membersOmanOther small statesPacific island small statesPakistanPalauPanamaPapua New GuineaParaguayPeruPhilippinesPolandPortugalPost-demographic dividendPre-demographic dividendQatarRomaniaRussian FederationRwandaSamoaSao Tome and PrincipeSaudi ArabiaSenegalSerbiaSeychellesSierra LeoneSingaporeSint Maarten (Dutch part)Slovak RepublicSloveniaSmall statesSolomon IslandsSouth AfricaSouth AsiaSouth Asia (IDA & IBRD)South SudanSpainSri LankaSt. Kitts and NevisSt. LuciaSt. Vincent and the GrenadinesSub-Saharan Africa Sub-Saharan Africa (excluding high income)Sub-Saharan Africa (IDA & IBRD countries)SudanSurinameSwazilandSwedenSwitzerlandSyrian Arab RepublicTajikistanTanzaniaThailandTimor-LesteTogoTongaTrinidad and TobagoTunisiaTurkeyTuvaluUgandaUkraineUnited KingdomUnited StatesUpper middle incomeUruguayVanuatuVenezuela, RBVietnamWest Bank and GazaWorldYemen, Rep.ZambiaZimbabwe La ligne de temps
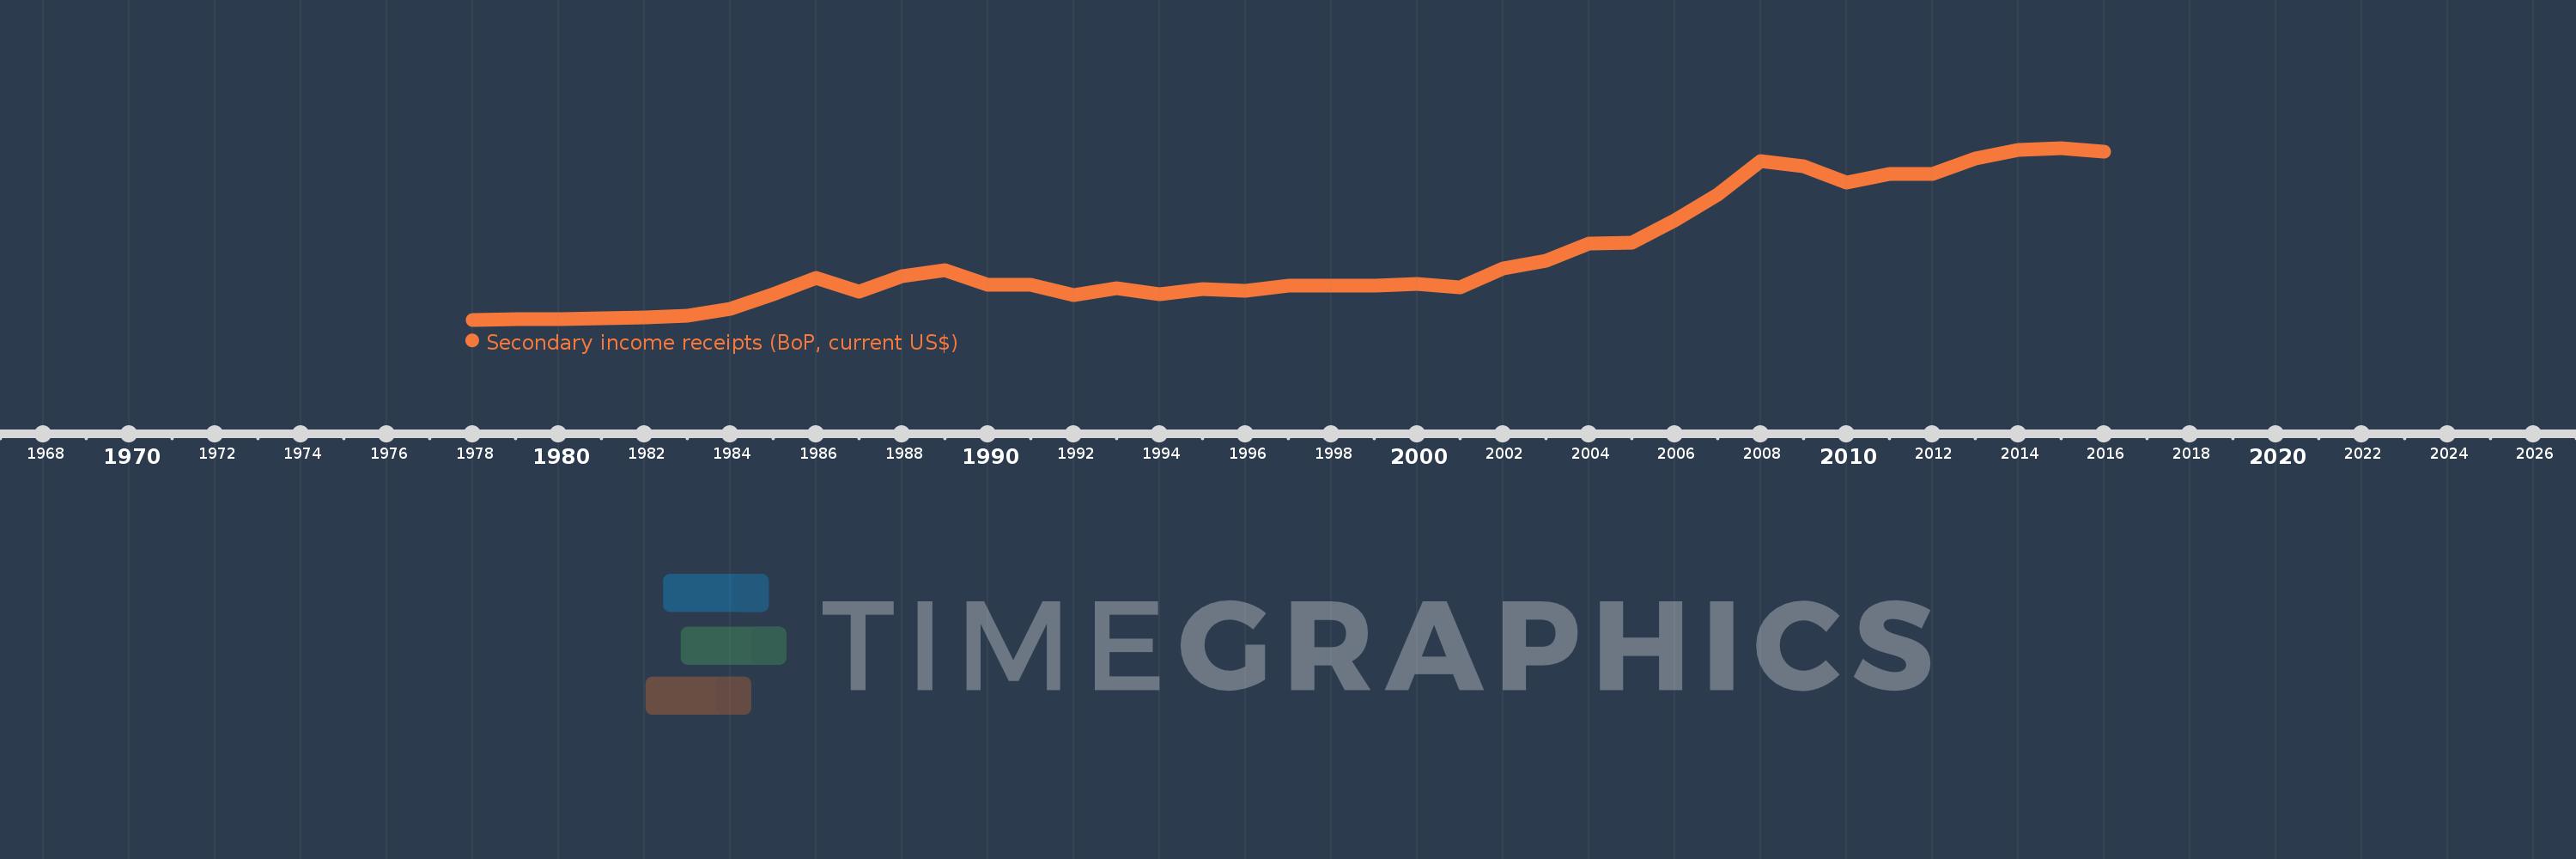
Cette échelle de temps montre un graphique de 1978 année à 2016 année Costa Rica. Les données jusqu'à 1977 année ne sont pas présentés. Quantité d'observations actuelles selon dates: 39.
Source (désignation):
Les indicateurs du développement mondiale
Source (organisation):
International Monetary Fund, Balance of Payments Statistics Yearbook and data files.
Catégories:
Economy & Growth
Dernière mise à jour
23 avr. 2017
Les indicateurs de changement de valeurs selon les années
Minimum:
26.4 mln.
1 janv. 1978
Maximum:
856.922 mln.
1 janv. 2015
Pour la date d''observation
Valeur
Changement absolu
Le changement par rapport à la valeur précédente
1 janv. 1978
26.4 mln.
+26.4 mln.
0.0%
1 janv. 1979
28.0 mln.
+1.6 mln.
6.06%
1 janv. 1980
30.1 mln.
+2.1 mln.
7.5%
1 janv. 1981
33.5 mln.
+3.4 mln.
11.3%
1 janv. 1982
36.9 mln.
+3.4 mln.
10.15%
1 janv. 1983
43.9 mln.
+7.0 mln.
18.97%
1 janv. 1984
78.3 mln.
+34.4 mln.
78.36%
1 janv. 1985
151.3 mln.
+73.0 mln.
93.23%
1 janv. 1986
229.3 mln.
+78.0 mln.
51.55%
1 janv. 1987
162.7 mln.
-66.6 mln.
-29.04%
1 janv. 1988
237.2 mln.
+74.5 mln.
45.79%
1 janv. 1989
266.9 mln.
+29.7 mln.
12.52%
1 janv. 1990
195.5 mln.
-71.4 mln.
-26.75%
1 janv. 1991
196.0 mln.
+500.0 milles
0.26%
1 janv. 1992
145.1 mln.
-50.9 mln.
-25.97%
1 janv. 1993
178.9 mln.
+33.8 mln.
23.29%
1 janv. 1994
149.3 mln.
-29.6 mln.
-16.55%
1 janv. 1995
174.9 mln.
+25.6 mln.
17.15%
1 janv. 1996
165.2 mln.
-9.7 mln.
-5.55%
1 janv. 1997
192.66 mln.
+27.46 mln.
16.62%
1 janv. 1998
191.18 mln.
-1.48 mln.
-0.77%
1 janv. 1999
190.52 mln.
-660.0 milles
-0.35%
1 janv. 2000
201.433 mln.
+10.913 mln.
5.73%
1 janv. 2001
182.401 mln.
-19.031 mln.
-9.45%
1 janv. 2002
273.29 mln.
+90.889 mln.
49.83%
1 janv. 2003
310.001 mln.
+36.71 mln.
13.43%
1 janv. 2004
394.14 mln.
+84.139 mln.
27.14%
1 janv. 2005
400.727 mln.
+6.588 mln.
1.67%
1 janv. 2006
505.165 mln.
+104.438 mln.
26.06%
1 janv. 2007
629.867 mln.
+124.701 mln.
24.69%
1 janv. 2008
794.196 mln.
+164.33 mln.
26.09%
1 janv. 2009
766.644 mln.
-27.552 mln.
-3.47%
1 janv. 2010
688.442 mln.
-78.202 mln.
-10.2%
1 janv. 2011
731.675 mln.
+43.233 mln.
6.28%
1 janv. 2012
730.886 mln.
-789.036 milles
-0.11%
1 janv. 2013
807.465 mln.
+76.579 mln.
10.48%
1 janv. 2014
848.481 mln.
+41.015 mln.
5.08%
1 janv. 2015
856.922 mln.
+8.441 mln.
0.99%
1 janv. 2016
840.714 mln.
-16.207 mln.
-1.89%
Classement des pays selon les statistiques actuelles par années


Commentaires: