29
/fr/
fr
AIzaSyAYiBZKx7MnpbEhh9jyipgxe19OcubqV5w
April 1, 2024
109098
Comoros
COM
true
2
1
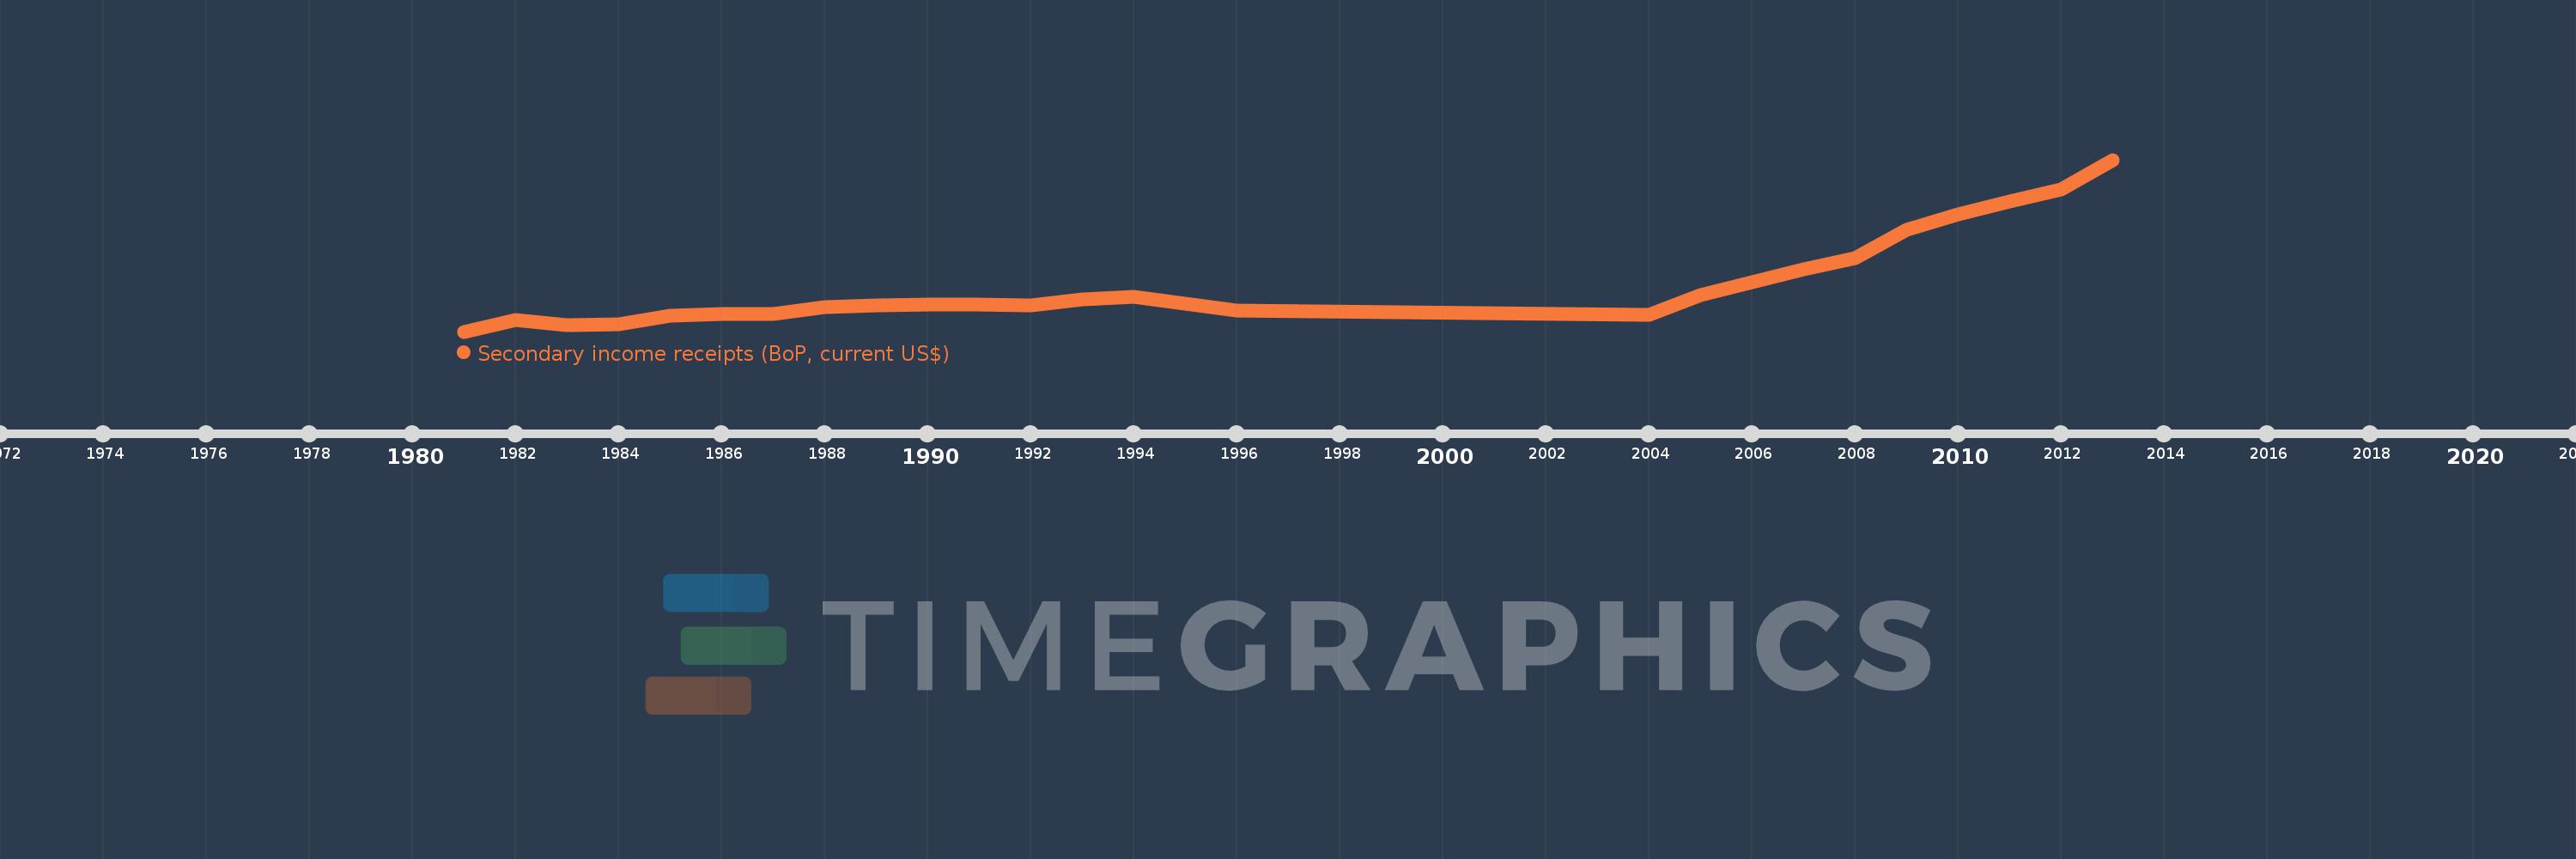
Secondary income receipts (BoP, current US$)
2013,2012,2011,2010,2009,2008,2007,2006,2005,2004,1996,1995,1994,1993,1992,1991,1990,1989,1988,1987,1986,1985,1984,1983,1982,1981
Cette statistique dans les autres pays:
AfghanistanAlbaniaAlgeriaAngolaAntigua and BarbudaArab WorldArgentinaArmeniaArubaAustraliaAustriaAzerbaijanBahamas, TheBahrainBangladeshBarbadosBelarusBelgiumBelizeBeninBermudaBhutanBoliviaBosnia and HerzegovinaBotswanaBrazilBrunei DarussalamBulgariaBurkina FasoBurundiCabo VerdeCambodiaCameroonCanadaCaribbean small statesCentral African RepublicCentral Europe and the BalticsChadChileChinaColombiaComorosCongo, Dem. Rep.Congo, Rep.Costa RicaCote d'IvoireCroatiaCuracaoCyprusCzech RepublicDenmarkDjiboutiDominicaDominican RepublicEarly-demographic dividendEast Asia & PacificEast Asia & Pacific (excluding high income)East Asia & Pacific (IDA & IBRD countries)EcuadorEgypt, Arab Rep.El SalvadorEquatorial GuineaEritreaEstoniaEthiopiaEuro areaEurope & Central AsiaEurope & Central Asia (excluding high income)Europe & Central Asia (IDA & IBRD countries)European UnionFaroe IslandsFijiFinlandFragile and conflict affected situationsFranceFrench PolynesiaGabonGambia, TheGeorgiaGermanyGhanaGreeceGrenadaGuatemalaGuineaGuinea-BissauGuyanaHaitiHeavily indebted poor countries (HIPC)High incomeHondurasHong Kong SAR, ChinaHungaryIBRD onlyIcelandIDA & IBRD totalIDA blendIDA onlyIDA totalIndiaIndonesiaIran, Islamic Rep.IraqIrelandIsraelItalyJamaicaJapanJordanKazakhstanKenyaKiribatiKorea, Rep.KosovoKuwaitKyrgyz RepublicLao PDRLate-demographic dividendLatin America & Caribbean Latin America & Caribbean (excluding high income)Latin America & the Caribbean (IDA & IBRD countries)LatviaLeast developed countries: UN classificationLebanonLesothoLiberiaLibyaLithuaniaLow & middle incomeLow incomeLower middle incomeLuxembourgMacao SAR, ChinaMacedonia, FYRMadagascarMalawiMalaysiaMaldivesMaliMaltaMarshall IslandsMauritaniaMauritiusMexicoMicronesia, Fed. Sts.Middle East & North AfricaMiddle East & North Africa (excluding high income)Middle East & North Africa (IDA & IBRD countries)Middle incomeMoldovaMongoliaMontenegroMoroccoMozambiqueMyanmarNamibiaNepalNetherlandsNew CaledoniaNew ZealandNicaraguaNigerNigeriaNorth AmericaNorwayOECD membersOmanOther small statesPacific island small statesPakistanPalauPanamaPapua New GuineaParaguayPeruPhilippinesPolandPortugalPost-demographic dividendPre-demographic dividendQatarRomaniaRussian FederationRwandaSamoaSao Tome and PrincipeSaudi ArabiaSenegalSerbiaSeychellesSierra LeoneSingaporeSint Maarten (Dutch part)Slovak RepublicSloveniaSmall statesSolomon IslandsSouth AfricaSouth AsiaSouth Asia (IDA & IBRD)South SudanSpainSri LankaSt. Kitts and NevisSt. LuciaSt. Vincent and the GrenadinesSub-Saharan Africa Sub-Saharan Africa (excluding high income)Sub-Saharan Africa (IDA & IBRD countries)SudanSurinameSwazilandSwedenSwitzerlandSyrian Arab RepublicTajikistanTanzaniaThailandTimor-LesteTogoTongaTrinidad and TobagoTunisiaTurkeyTuvaluUgandaUkraineUnited KingdomUnited StatesUpper middle incomeUruguayVanuatuVenezuela, RBVietnamWest Bank and GazaWorldYemen, Rep.ZambiaZimbabwe La ligne de temps
Cette échelle de temps montre un graphique de 1981 année à 2013 année Comoros. Les données jusqu'à 1980 année ne sont pas présentés. Quantité d'observations actuelles selon dates: 26.
Source (désignation):
Les indicateurs du développement mondiale
Source (organisation):
International Monetary Fund, Balance of Payments Statistics Yearbook and data files.
Catégories:
Economy & Growth
Dernière mise à jour
23 avr. 2017
Les indicateurs de changement de valeurs selon les années
Minimum:
12.884 mln.
1 janv. 1981
Maximum:
242.783 mln.
1 janv. 2013
Pour la date d''observation
Valeur
Changement absolu
Le changement par rapport à la valeur précédente
1 janv. 1981
12.884 mln.
+12.884 mln.
0.0%
1 janv. 1982
28.094 mln.
+15.211 mln.
118.06%
1 janv. 1983
21.847 mln.
-6.247 mln.
-22.24%
1 janv. 1984
22.091 mln.
+243.846 milles
1.12%
1 janv. 1985
33.887 mln.
+11.796 mln.
53.4%
1 janv. 1986
36.611 mln.
+2.724 mln.
8.04%
1 janv. 1987
36.971 mln.
+359.132 milles
0.98%
1 janv. 1988
45.858 mln.
+8.888 mln.
24.04%
1 janv. 1989
48.404 mln.
+2.546 mln.
5.55%
1 janv. 1990
49.165 mln.
+761.023 milles
1.57%
1 janv. 1991
49.408 mln.
+242.922 milles
0.49%
1 janv. 1992
47.44 mln.
-1.968 mln.
-3.98%
1 janv. 1993
56.115 mln.
+8.675 mln.
18.29%
1 janv. 1994
59.832 mln.
+3.717 mln.
6.62%
1 janv. 1995
49.952 mln.
-9.88 mln.
-16.51%
1 janv. 1996
41.057 mln.
-8.895 mln.
-17.81%
1 janv. 2004
35.77 mln.
-5.287 mln.
-12.88%
1 janv. 2005
62.227 mln.
+26.457 mln.
73.96%
1 janv. 2006
78.829 mln.
+16.603 mln.
26.68%
1 janv. 2007
96.111 mln.
+17.282 mln.
21.92%
1 janv. 2008
111.157 mln.
+15.046 mln.
15.65%
1 janv. 2009
148.889 mln.
+37.732 mln.
33.94%
1 janv. 2010
169.26 mln.
+20.371 mln.
13.68%
1 janv. 2011
186.937 mln.
+17.677 mln.
10.44%
1 janv. 2012
203.317 mln.
+16.38 mln.
8.76%
1 janv. 2013
242.783 mln.
+39.466 mln.
19.41%
Classement des pays selon les statistiques actuelles par années


Commentaires: