29
/fr/
fr
AIzaSyAYiBZKx7MnpbEhh9jyipgxe19OcubqV5w
April 1, 2024
106636
China
CHN
true
2
1
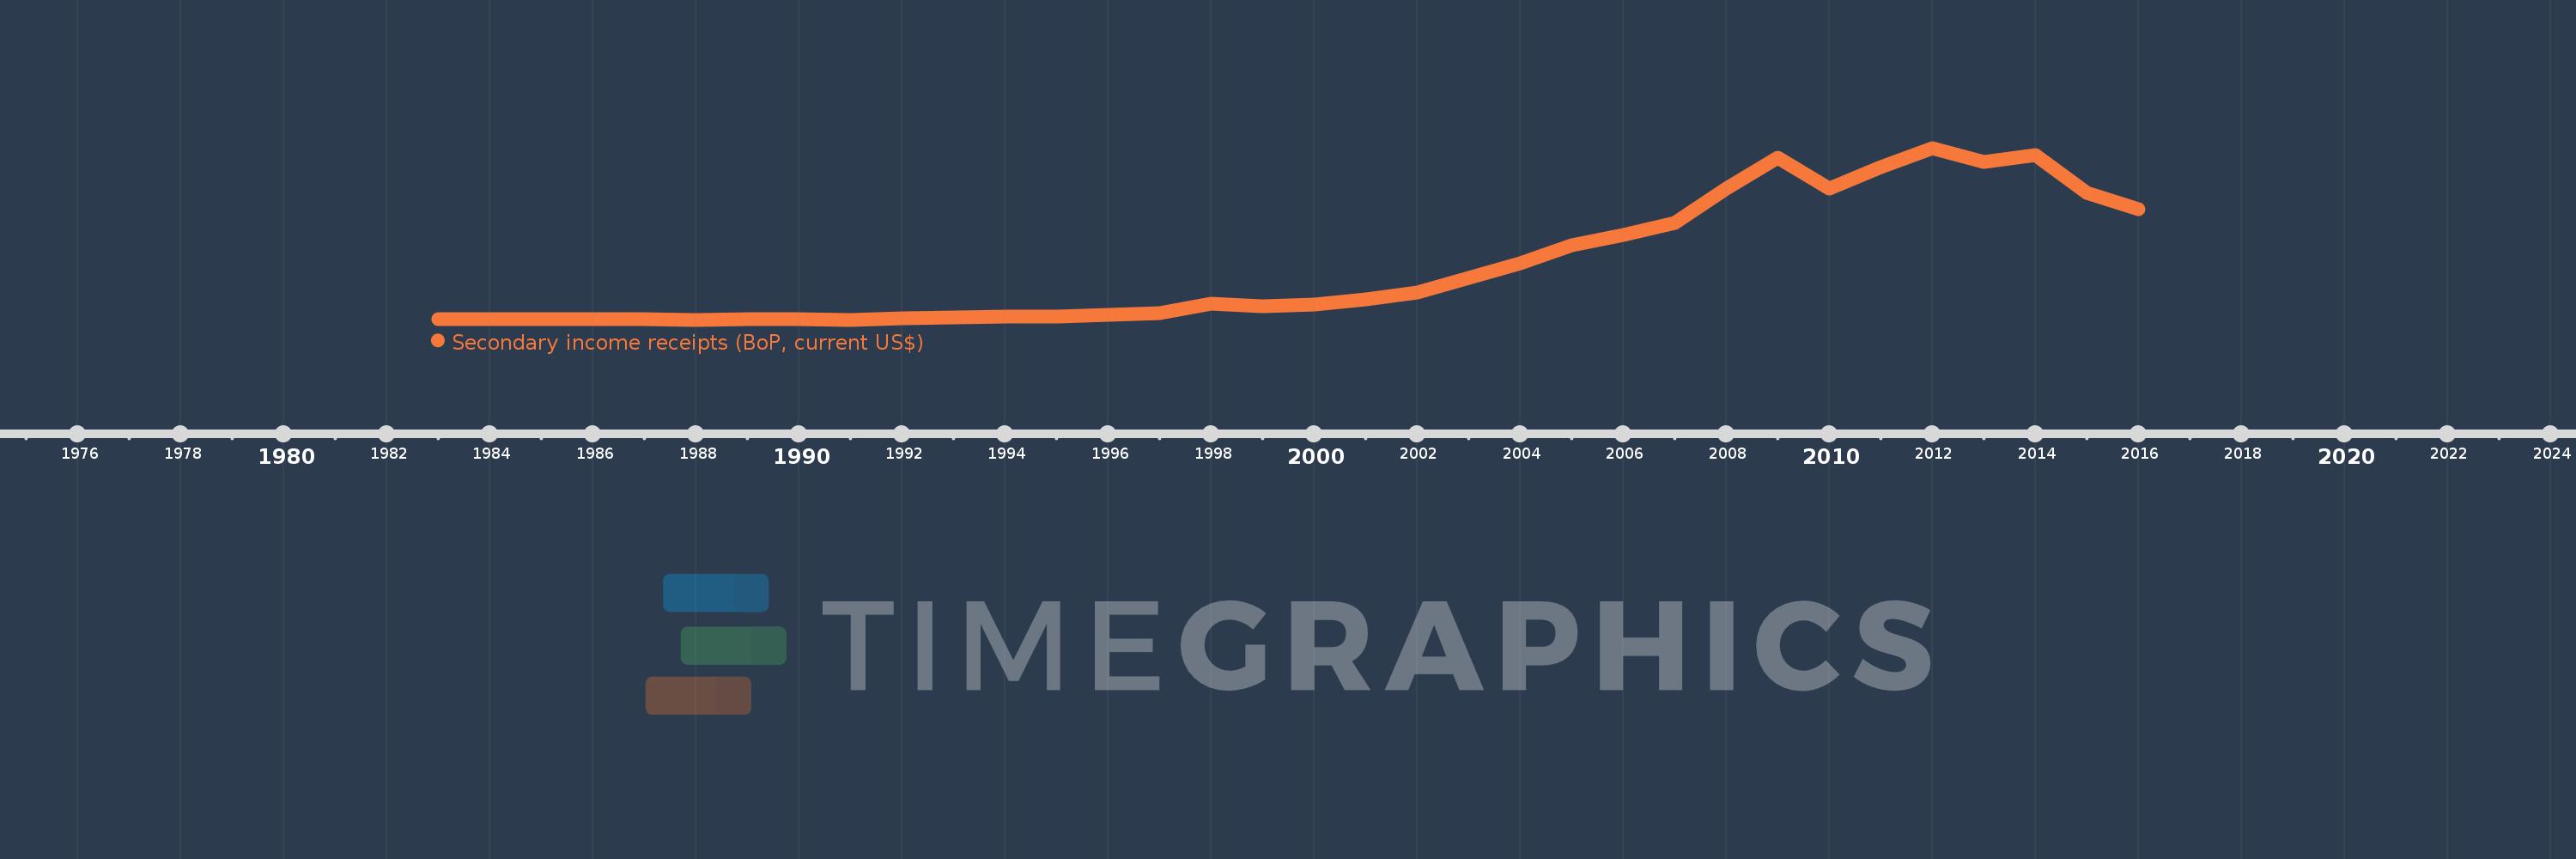
Secondary income receipts (BoP, current US$)
2016,2015,2014,2013,2012,2011,2010,2009,2008,2007,2006,2005,2004,2003,2002,2001,2000,1999,1998,1997,1996,1995,1994,1993,1992,1991,1990,1989,1988,1987,1986,1985,1984,1983
Cette statistique dans les autres pays:
AfghanistanAlbaniaAlgeriaAngolaAntigua and BarbudaArab WorldArgentinaArmeniaArubaAustraliaAustriaAzerbaijanBahamas, TheBahrainBangladeshBarbadosBelarusBelgiumBelizeBeninBermudaBhutanBoliviaBosnia and HerzegovinaBotswanaBrazilBrunei DarussalamBulgariaBurkina FasoBurundiCabo VerdeCambodiaCameroonCanadaCaribbean small statesCentral African RepublicCentral Europe and the BalticsChadChileChinaColombiaComorosCongo, Dem. Rep.Congo, Rep.Costa RicaCote d'IvoireCroatiaCuracaoCyprusCzech RepublicDenmarkDjiboutiDominicaDominican RepublicEarly-demographic dividendEast Asia & PacificEast Asia & Pacific (excluding high income)East Asia & Pacific (IDA & IBRD countries)EcuadorEgypt, Arab Rep.El SalvadorEquatorial GuineaEritreaEstoniaEthiopiaEuro areaEurope & Central AsiaEurope & Central Asia (excluding high income)Europe & Central Asia (IDA & IBRD countries)European UnionFaroe IslandsFijiFinlandFragile and conflict affected situationsFranceFrench PolynesiaGabonGambia, TheGeorgiaGermanyGhanaGreeceGrenadaGuatemalaGuineaGuinea-BissauGuyanaHaitiHeavily indebted poor countries (HIPC)High incomeHondurasHong Kong SAR, ChinaHungaryIBRD onlyIcelandIDA & IBRD totalIDA blendIDA onlyIDA totalIndiaIndonesiaIran, Islamic Rep.IraqIrelandIsraelItalyJamaicaJapanJordanKazakhstanKenyaKiribatiKorea, Rep.KosovoKuwaitKyrgyz RepublicLao PDRLate-demographic dividendLatin America & Caribbean Latin America & Caribbean (excluding high income)Latin America & the Caribbean (IDA & IBRD countries)LatviaLeast developed countries: UN classificationLebanonLesothoLiberiaLibyaLithuaniaLow & middle incomeLow incomeLower middle incomeLuxembourgMacao SAR, ChinaMacedonia, FYRMadagascarMalawiMalaysiaMaldivesMaliMaltaMarshall IslandsMauritaniaMauritiusMexicoMicronesia, Fed. Sts.Middle East & North AfricaMiddle East & North Africa (excluding high income)Middle East & North Africa (IDA & IBRD countries)Middle incomeMoldovaMongoliaMontenegroMoroccoMozambiqueMyanmarNamibiaNepalNetherlandsNew CaledoniaNew ZealandNicaraguaNigerNigeriaNorth AmericaNorwayOECD membersOmanOther small statesPacific island small statesPakistanPalauPanamaPapua New GuineaParaguayPeruPhilippinesPolandPortugalPost-demographic dividendPre-demographic dividendQatarRomaniaRussian FederationRwandaSamoaSao Tome and PrincipeSaudi ArabiaSenegalSerbiaSeychellesSierra LeoneSingaporeSint Maarten (Dutch part)Slovak RepublicSloveniaSmall statesSolomon IslandsSouth AfricaSouth AsiaSouth Asia (IDA & IBRD)South SudanSpainSri LankaSt. Kitts and NevisSt. LuciaSt. Vincent and the GrenadinesSub-Saharan Africa Sub-Saharan Africa (excluding high income)Sub-Saharan Africa (IDA & IBRD countries)SudanSurinameSwazilandSwedenSwitzerlandSyrian Arab RepublicTajikistanTanzaniaThailandTimor-LesteTogoTongaTrinidad and TobagoTunisiaTurkeyTuvaluUgandaUkraineUnited KingdomUnited StatesUpper middle incomeUruguayVanuatuVenezuela, RBVietnamWest Bank and GazaWorldYemen, Rep.ZambiaZimbabwe La ligne de temps
Cette échelle de temps montre un graphique de 1983 année à 2016 année China. Les données jusqu'à 1982 année ne sont pas présentés. Quantité d'observations actuelles selon dates: 34.
Source (désignation):
Les indicateurs du développement mondiale
Source (organisation):
International Monetary Fund, Balance of Payments Statistics Yearbook and data files.
Catégories:
Economy & Growth
Dernière mise à jour
23 avr. 2017
Les indicateurs de changement de valeurs selon les années
Minimum:
376.0 mln.
1 janv. 1991
Maximum:
55.57 mds
1 janv. 2012
Pour la date d''observation
Valeur
Changement absolu
Le changement par rapport à la valeur précédente
1 janv. 1983
672.0 mln.
+672.0 mln.
0.0%
1 janv. 1984
620.0 mln.
-52.0 mln.
-7.74%
1 janv. 1985
596.0 mln.
-24.0 mln.
-3.87%
1 janv. 1986
439.0 mln.
-157.0 mln.
-26.34%
1 janv. 1987
516.0 mln.
+77.0 mln.
17.54%
1 janv. 1988
389.0 mln.
-127.0 mln.
-24.61%
1 janv. 1989
568.0 mln.
+179.0 mln.
46.02%
1 janv. 1990
477.0 mln.
-91.0 mln.
-16.02%
1 janv. 1991
376.0 mln.
-101.0 mln.
-21.17%
1 janv. 1992
890.0 mln.
+514.0 mln.
136.7%
1 janv. 1993
1.206 mds
+316.0 mln.
35.51%
1 janv. 1994
1.29 mds
+84.0 mln.
6.97%
1 janv. 1995
1.269 mds
-21.0 mln.
-1.63%
1 janv. 1996
1.827 mds
+557.73 mln.
43.95%
1 janv. 1997
2.368 mds
+541.27 mln.
29.63%
1 janv. 1998
5.477 mds
+3.109 mds
131.29%
1 janv. 1999
4.661 mds
-816.0 mln.
-14.9%
1 janv. 2000
5.368 mds
+707.0 mln.
15.17%
1 janv. 2001
6.861 mds
+1.493 mds
27.81%
1 janv. 2002
9.125 mds
+2.264 mds
33.0%
1 janv. 2003
13.795 mds
+4.67 mds
51.18%
1 janv. 2004
18.482 mds
+4.687 mds
33.98%
1 janv. 2005
24.326 mds
+5.844 mds
31.62%
1 janv. 2006
27.735 mds
+3.409 mds
14.01%
1 janv. 2007
31.578 mds
+3.843 mds
13.86%
1 janv. 2008
42.646 mds
+11.068 mds
35.05%
1 janv. 2009
52.565 mds
+9.919 mds
23.26%
1 janv. 2010
42.645 mds
-9.92 mds
-18.87%
1 janv. 2011
49.521 mds
+6.876 mds
16.12%
1 janv. 2012
55.57 mds
+6.049 mds
12.22%
1 janv. 2013
51.167 mds
-4.403 mds
-7.92%
1 janv. 2014
53.162 mds
+1.995 mds
3.9%
1 janv. 2015
41.127 mds
-12.035 mds
-22.64%
1 janv. 2016
35.938 mds
-5.188 mds
-12.62%
Classement des pays selon les statistiques actuelles par années


Commentaires: