29
/es/
es
AIzaSyAYiBZKx7MnpbEhh9jyipgxe19OcubqV5w
April 1, 2024
99978
Cameroon
CMR
true
2
1
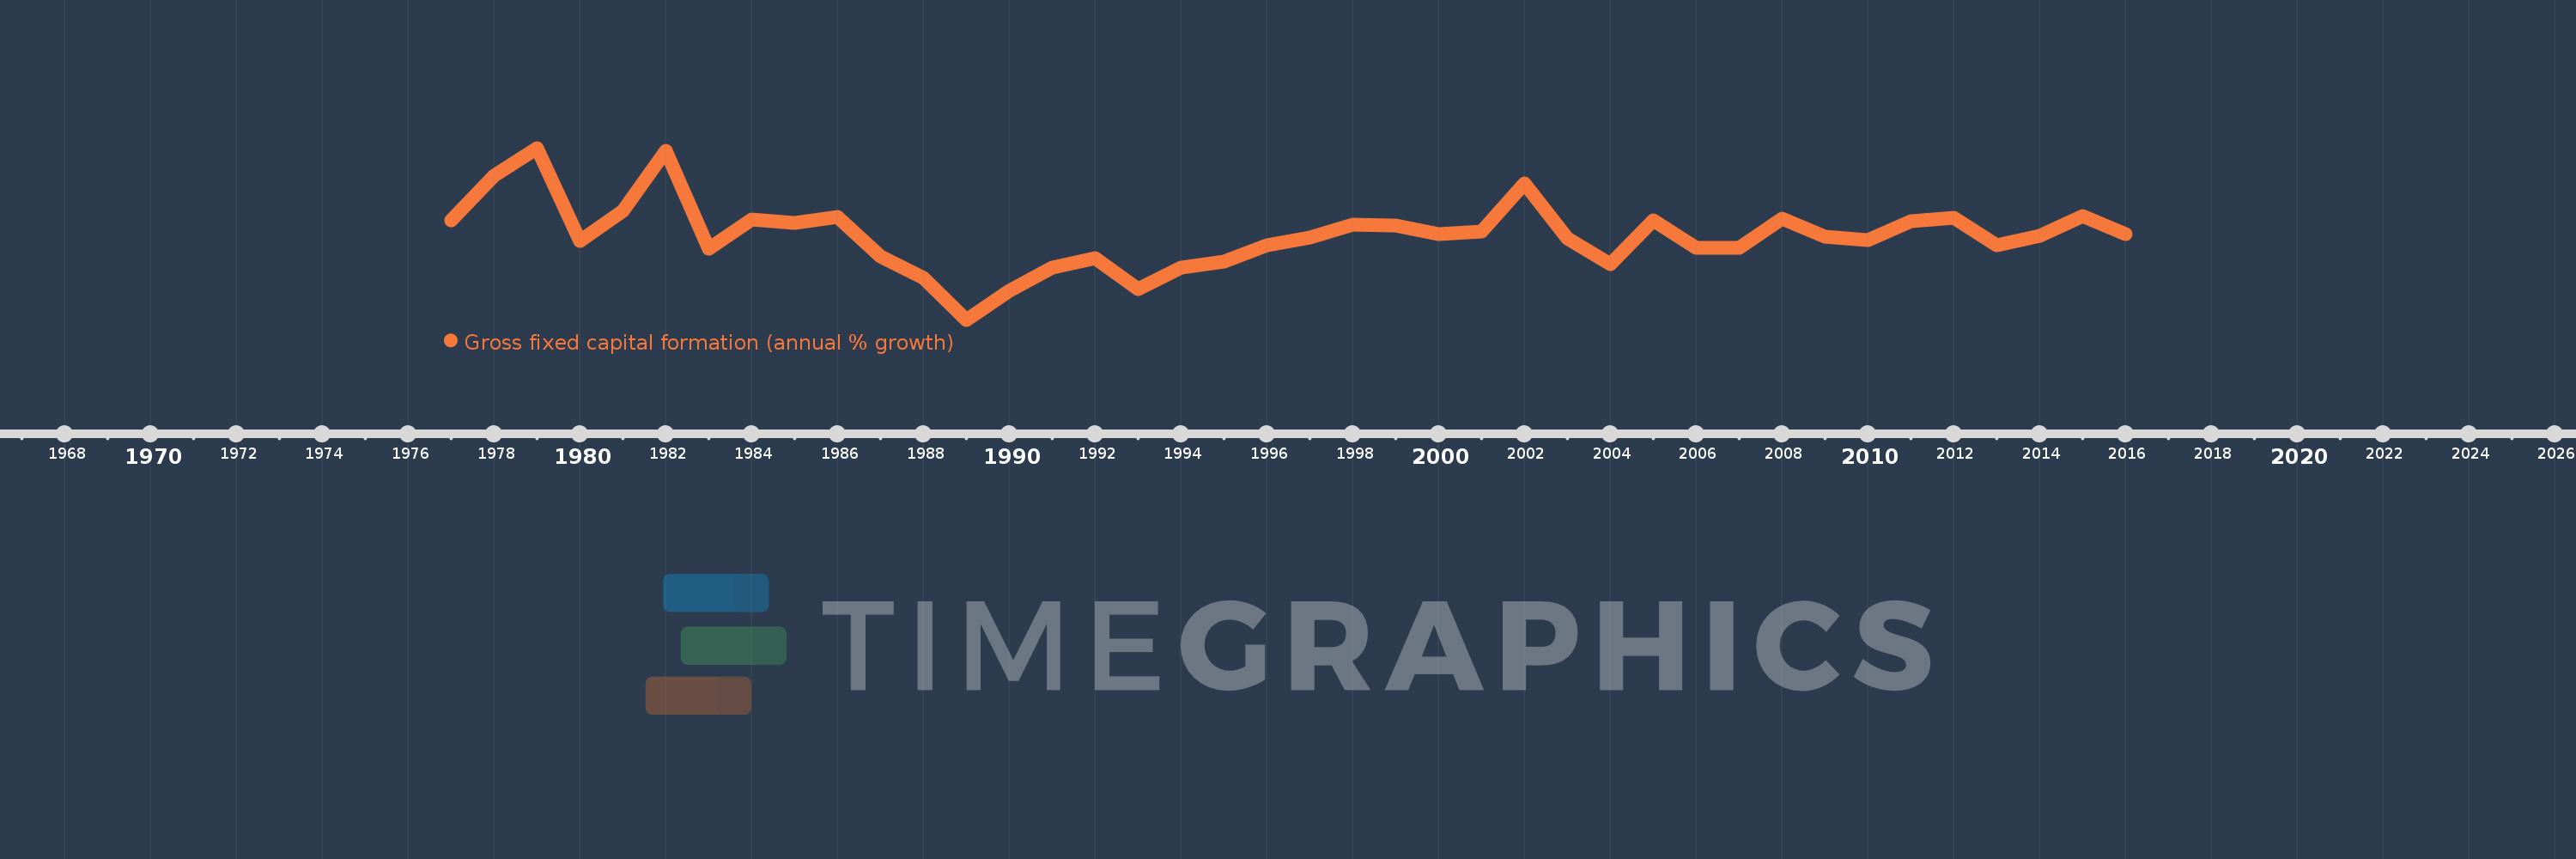
Gross fixed capital formation (annual % growth)
2016,2015,2014,2013,2012,2011,2010,2009,2008,2007,2006,2005,2004,2003,2002,2001,2000,1999,1998,1997,1996,1995,1994,1993,1992,1991,1990,1989,1988,1987,1986,1985,1984,1983,1982,1981,1980,1979,1978,1977
Estas estadísticas en otros países:
AlbaniaAlgeriaAntigua and BarbudaArab WorldArgentinaArmeniaAustraliaAustriaAzerbaijanBahamas, TheBahrainBangladeshBarbadosBelarusBelgiumBelizeBeninBhutanBoliviaBosnia and HerzegovinaBotswanaBrazilBrunei DarussalamBulgariaBurkina FasoBurundiCabo VerdeCambodiaCameroonCanadaCaribbean small statesCentral Europe and the BalticsChadChileChinaColombiaComorosCongo, Dem. Rep.Congo, Rep.Costa RicaCote d'IvoireCroatiaCubaCyprusCzech RepublicDenmarkDjiboutiDominican RepublicEarly-demographic dividendEast Asia & PacificEast Asia & Pacific (excluding high income)East Asia & Pacific (IDA & IBRD countries)EcuadorEgypt, Arab Rep.El SalvadorEquatorial GuineaEritreaEstoniaEthiopiaEuro areaEurope & Central AsiaEurope & Central Asia (excluding high income)Europe & Central Asia (IDA & IBRD countries)European UnionFinlandFranceGabonGambia, TheGeorgiaGermanyGhanaGreeceGuatemalaGuineaGuinea-BissauHaitiHeavily indebted poor countries (HIPC)High incomeHondurasHong Kong SAR, ChinaHungaryIBRD onlyIcelandIDA & IBRD totalIDA blendIDA onlyIDA totalIndiaIndonesiaIran, Islamic Rep.IrelandIsraelItalyJamaicaJapanJordanKazakhstanKenyaKorea, Rep.KosovoKyrgyz RepublicLao PDRLate-demographic dividendLatin America & Caribbean Latin America & Caribbean (excluding high income)Latin America & the Caribbean (IDA & IBRD countries)LatviaLeast developed countries: UN classificationLebanonLiberiaLithuaniaLow & middle incomeLow incomeLower middle incomeLuxembourgMacao SAR, ChinaMacedonia, FYRMadagascarMalawiMalaysiaMaliMaltaMauritaniaMauritiusMexicoMiddle East & North AfricaMiddle East & North Africa (excluding high income)Middle East & North Africa (IDA & IBRD countries)Middle incomeMoldovaMongoliaMontenegroMoroccoMozambiqueNamibiaNepalNetherlandsNew ZealandNicaraguaNigerNigeriaNorth AmericaNorwayOECD membersOmanPakistanPanamaPapua New GuineaParaguayPeruPhilippinesPolandPortugalPost-demographic dividendPre-demographic dividendPuerto RicoRomaniaRussian FederationRwandaSaudi ArabiaSenegalSerbiaSeychellesSierra LeoneSingaporeSlovak RepublicSloveniaSomaliaSouth AfricaSouth AsiaSouth Asia (IDA & IBRD)South SudanSpainSri LankaSub-Saharan Africa Sub-Saharan Africa (excluding high income)Sub-Saharan Africa (IDA & IBRD countries)SudanSurinameSwazilandSwedenSwitzerlandSyrian Arab RepublicTajikistanTanzaniaThailandTimor-LesteTogoTrinidad and TobagoTunisiaTurkeyUgandaUkraineUnited Arab EmiratesUnited KingdomUnited StatesUpper middle incomeUruguayUzbekistanVanuatuVenezuela, RBVietnamWest Bank and GazaWorldZimbabwe línea de tiempo (timeline):
En esta escala de tiempo se presenta un gráfico de 1977 y 2016 de Cameroon. Los datos de 1976 están ausentes. El número de observaciones reales por fecha: 40.
Fuente (nombre):
Indicadores del desarrollo mundial
Fuente (organización):
World Bank national accounts data, and OECD National Accounts data files.
Categorías:
Economy & Growth
Se ha actualizado:
23 abr 2017 año
Los indicadores de los cambios de valor en los últimos años
Mínimo:
-27.6
1 ene 1989 año
Máximo:
39.248
1 ene 1979 año
A la fecha de observación
Valor
Cambio absoluto
El cambio con respecto al valor anterior
1 ene 1977 año
11.224
+11.224
0.0%
1 ene 1978 año
28.4
+17.176
153.03%
1 ene 1979 año
39.248
+10.849
38.2%
1 ene 1980 año
3.17
-36.078
-91.92%
1 ene 1981 año
14.787
+11.617
366.43%
1 ene 1982 año
38.067
+23.279
157.43%
1 ene 1983 año
0.0
-38.067
-100.0%
1 ene 1984 año
11.3
+11.3
%
1 ene 1985 año
10.2
-1.1
-9.73%
1 ene 1986 año
12.4
+2.2
21.57%
1 ene 1987 año
-2.8
-15.2
-122.58%
1 ene 1988 año
-11.4
-8.6
307.14%
1 ene 1989 año
-27.6
-16.2
142.11%
1 ene 1990 año
-16.5
+11.1
-40.22%
1 ene 1991 año
-7.2
+9.3
-56.36%
1 ene 1992 año
-3.7
+3.5
-48.61%
1 ene 1993 año
-15.735
-12.035
325.28%
1 ene 1994 año
-7.15
+8.586
-54.56%
1 ene 1995 año
-5.099
+2.051
-28.68%
1 ene 1996 año
1.456
+6.555
-128.55%
1 ene 1997 año
4.464
+3.008
206.66%
1 ene 1998 año
9.48
+5.015
112.35%
1 ene 1999 año
9.064
-0.416
-4.38%
1 ene 2000 año
5.711
-3.353
-36.99%
1 ene 2001 año
6.722
+1.011
17.71%
1 ene 2002 año
25.343
+18.621
277.01%
1 ene 2003 año
3.981
-21.362
-84.29%
1 ene 2004 año
-5.882
-9.863
-247.76%
1 ene 2005 año
11.097
+16.979
-288.65%
1 ene 2006 año
0.492
-10.605
-95.57%
1 ene 2007 año
0.243
-0.249
-50.64%
1 ene 2008 año
11.66
+11.418
4.7 mil%
1 ene 2009 año
4.62
-7.041
-60.38%
1 ene 2010 año
3.478
-1.141
-24.7%
1 ene 2011 año
10.728
+7.249
208.4%
1 ene 2012 año
12.128
+1.401
13.06%
1 ene 2013 año
1.39
-10.738
-88.54%
1 ene 2014 año
5.181
+3.791
272.8%
1 ene 2015 año
12.906
+7.725
149.11%
1 ene 2016 año
5.862
-7.043
-54.58%
Ranking de los países por los datos estadísticos actuales


Comentarios: