29
/es/
es
AIzaSyAYiBZKx7MnpbEhh9jyipgxe19OcubqV5w
April 1, 2024
150433
Honduras
HND
true
2
1
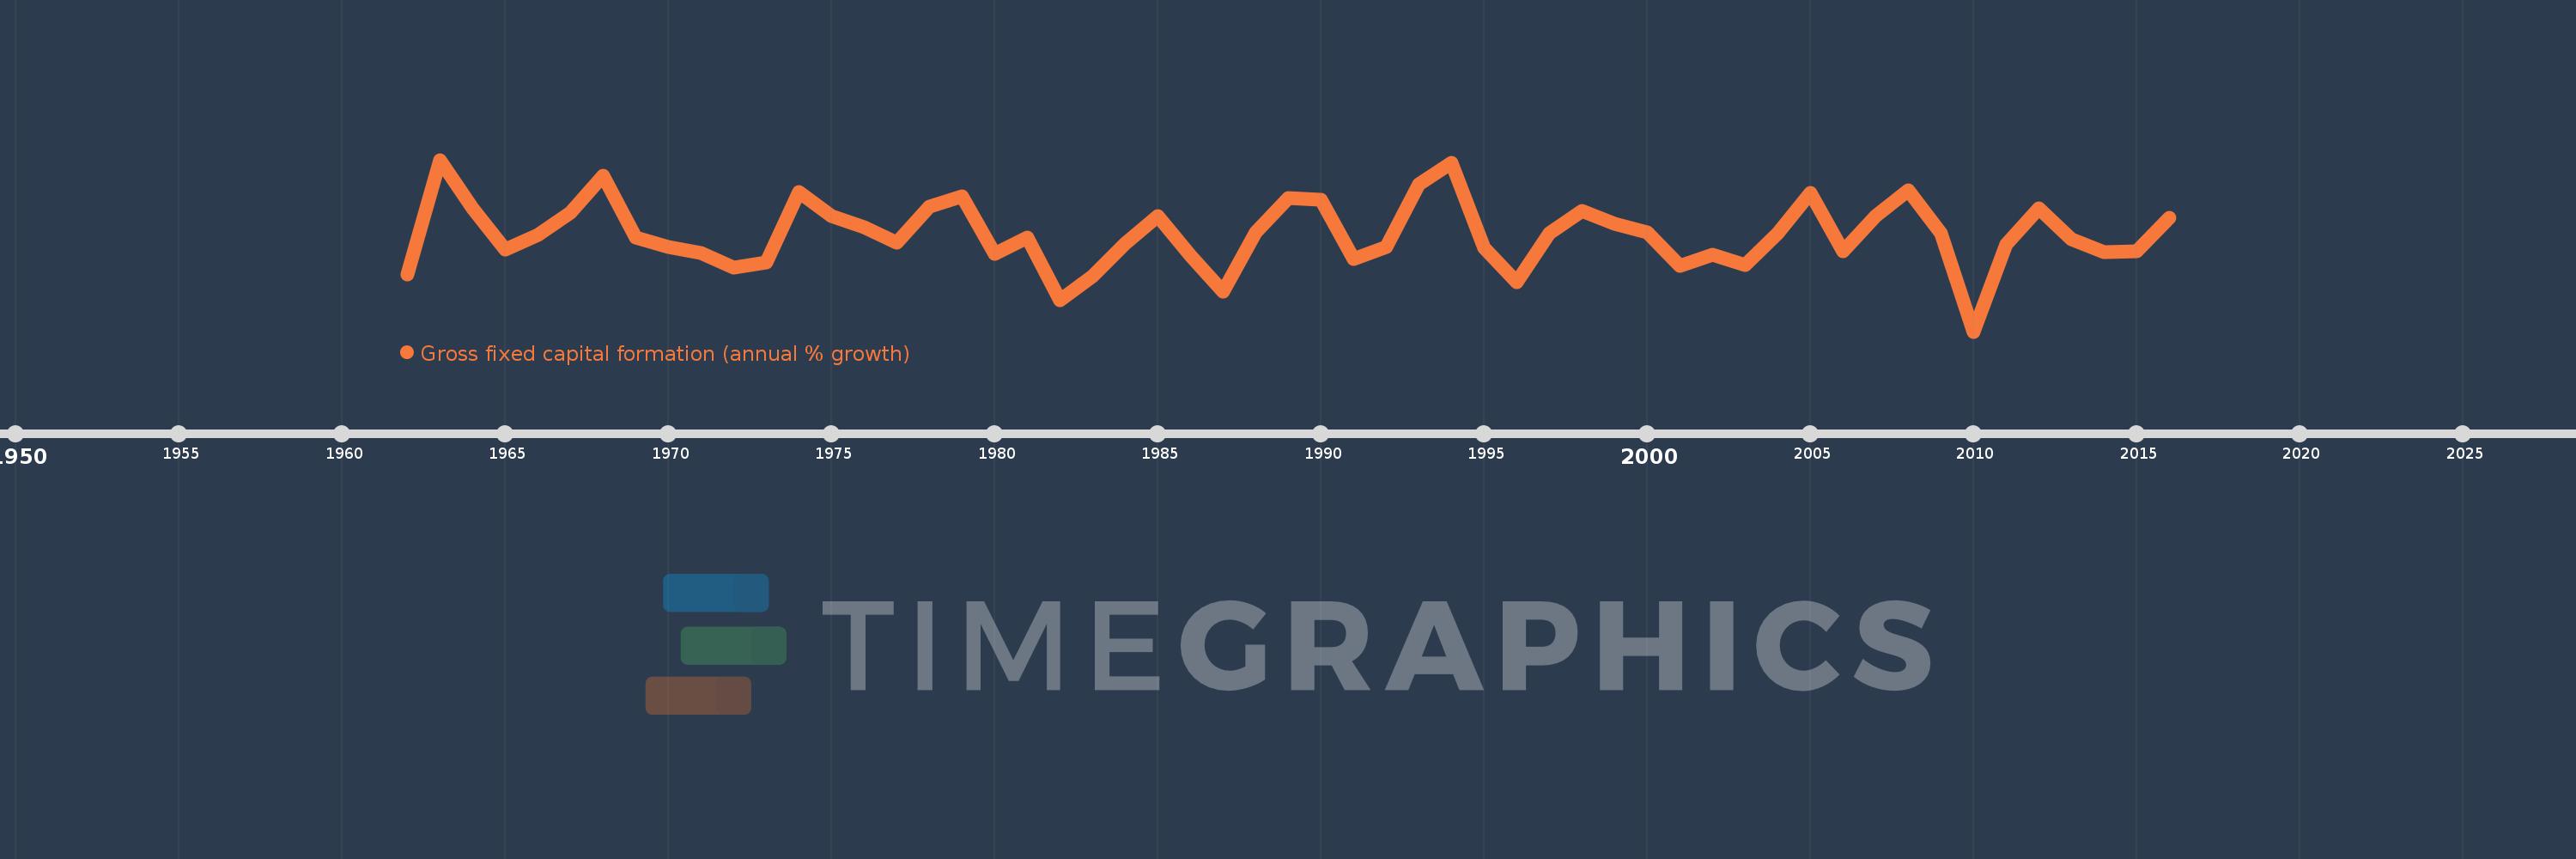
Gross fixed capital formation (annual % growth)
2016,2015,2014,2013,2012,2011,2010,2009,2008,2007,2006,2005,2004,2003,2002,2001,2000,1999,1998,1997,1996,1995,1994,1993,1992,1991,1990,1989,1988,1987,1986,1985,1984,1983,1982,1981,1980,1979,1978,1977,1976,1975,1974,1973,1972,1971,1970,1969,1968,1967,1966,1965,1964,1963,1962
Estas estadísticas en otros países:
AlbaniaAlgeriaAntigua and BarbudaArab WorldArgentinaArmeniaAustraliaAustriaAzerbaijanBahamas, TheBahrainBangladeshBarbadosBelarusBelgiumBelizeBeninBhutanBoliviaBosnia and HerzegovinaBotswanaBrazilBrunei DarussalamBulgariaBurkina FasoBurundiCabo VerdeCambodiaCameroonCanadaCaribbean small statesCentral Europe and the BalticsChadChileChinaColombiaComorosCongo, Dem. Rep.Congo, Rep.Costa RicaCote d'IvoireCroatiaCubaCyprusCzech RepublicDenmarkDjiboutiDominican RepublicEarly-demographic dividendEast Asia & PacificEast Asia & Pacific (excluding high income)East Asia & Pacific (IDA & IBRD countries)EcuadorEgypt, Arab Rep.El SalvadorEquatorial GuineaEritreaEstoniaEthiopiaEuro areaEurope & Central AsiaEurope & Central Asia (excluding high income)Europe & Central Asia (IDA & IBRD countries)European UnionFinlandFranceGabonGambia, TheGeorgiaGermanyGhanaGreeceGuatemalaGuineaGuinea-BissauHaitiHeavily indebted poor countries (HIPC)High incomeHondurasHong Kong SAR, ChinaHungaryIBRD onlyIcelandIDA & IBRD totalIDA blendIDA onlyIDA totalIndiaIndonesiaIran, Islamic Rep.IrelandIsraelItalyJamaicaJapanJordanKazakhstanKenyaKorea, Rep.KosovoKyrgyz RepublicLao PDRLate-demographic dividendLatin America & Caribbean Latin America & Caribbean (excluding high income)Latin America & the Caribbean (IDA & IBRD countries)LatviaLeast developed countries: UN classificationLebanonLiberiaLithuaniaLow & middle incomeLow incomeLower middle incomeLuxembourgMacao SAR, ChinaMacedonia, FYRMadagascarMalawiMalaysiaMaliMaltaMauritaniaMauritiusMexicoMiddle East & North AfricaMiddle East & North Africa (excluding high income)Middle East & North Africa (IDA & IBRD countries)Middle incomeMoldovaMongoliaMontenegroMoroccoMozambiqueNamibiaNepalNetherlandsNew ZealandNicaraguaNigerNigeriaNorth AmericaNorwayOECD membersOmanPakistanPanamaPapua New GuineaParaguayPeruPhilippinesPolandPortugalPost-demographic dividendPre-demographic dividendPuerto RicoRomaniaRussian FederationRwandaSaudi ArabiaSenegalSerbiaSeychellesSierra LeoneSingaporeSlovak RepublicSloveniaSomaliaSouth AfricaSouth AsiaSouth Asia (IDA & IBRD)South SudanSpainSri LankaSub-Saharan Africa Sub-Saharan Africa (excluding high income)Sub-Saharan Africa (IDA & IBRD countries)SudanSurinameSwazilandSwedenSwitzerlandSyrian Arab RepublicTajikistanTanzaniaThailandTimor-LesteTogoTrinidad and TobagoTunisiaTurkeyUgandaUkraineUnited Arab EmiratesUnited KingdomUnited StatesUpper middle incomeUruguayUzbekistanVanuatuVenezuela, RBVietnamWest Bank and GazaWorldZimbabwe línea de tiempo (timeline):
En esta escala de tiempo se presenta un gráfico de 1962 y 2016 de Honduras. Los datos de 1961 están ausentes. El número de observaciones reales por fecha: 55.
Fuente (nombre):
Indicadores del desarrollo mundial
Fuente (organización):
World Bank national accounts data, and OECD National Accounts data files.
Categorías:
Economy & Growth
Se ha actualizado:
23 abr 2017 año
Los indicadores de los cambios de valor en los últimos años
Mínimo:
-35.386
1 ene 2010 año
Máximo:
37.254
1 ene 1963 año
A la fecha de observación
Valor
Cambio absoluto
El cambio con respecto al valor anterior
1 ene 1962 año
-11.158
-11.158
0.0%
1 ene 1963 año
37.254
+48.412
-433.86%
1 ene 1964 año
16.712
-20.542
-55.14%
1 ene 1965 año
-0.831
-17.542
-104.97%
1 ene 1966 año
5.394
+6.224
-749.4%
1 ene 1967 año
14.908
+9.514
176.39%
1 ene 1968 año
30.65
+15.742
105.6%
1 ene 1969 año
4.235
-26.415
-86.18%
1 ene 1970 año
0.548
-3.686
-87.05%
1 ene 1971 año
-2.02
-2.569
-468.35%
1 ene 1972 año
-8.247
-6.227
308.25%
1 ene 1973 año
-6.292
+1.955
-23.71%
1 ene 1974 año
23.741
+30.033
-477.31%
1 ene 1975 año
13.372
-10.369
-43.68%
1 ene 1976 año
8.889
-4.483
-33.53%
1 ene 1977 año
2.355
-6.534
-73.51%
1 ene 1978 año
17.331
+14.976
636.0%
1 ene 1979 año
21.83
+4.499
25.96%
1 ene 1980 año
-2.575
-24.405
-111.8%
1 ene 1981 año
4.405
+6.98
-271.07%
1 ene 1982 año
-22.152
-26.557
-602.85%
1 ene 1983 año
-12.06
+10.092
-45.56%
1 ene 1984 año
1.695
+13.755
-114.05%
1 ene 1985 año
13.636
+11.941
704.55%
1 ene 1986 año
-3.2
-16.836
-123.47%
1 ene 1987 año
-18.595
-15.395
481.09%
1 ene 1988 año
6.599
+25.194
-135.49%
1 ene 1989 año
21.27
+14.671
222.32%
1 ene 1990 año
20.419
-0.851
-4.0%
1 ene 1991 año
-4.674
-25.093
-122.89%
1 ene 1992 año
0.228
+4.902
-104.88%
1 ene 1993 año
26.962
+26.734
11.72 mil%
1 ene 1994 año
35.842
+8.88
32.93%
1 ene 1995 año
-0.132
-35.974
-100.37%
1 ene 1996 año
-14.399
-14.267
10.81 mil%
1 ene 1997 año
6.327
+20.726
-143.94%
1 ene 1998 año
15.82
+9.493
150.03%
1 ene 1999 año
10.338
-5.482
-34.65%
1 ene 2000 año
6.53
-3.808
-36.83%
1 ene 2001 año
-7.623
-14.153
-216.73%
1 ene 2002 año
-3.01
+4.613
-60.52%
1 ene 2003 año
-7.284
-4.274
142.0%
1 ene 2004 año
6.188
+13.471
-184.95%
1 ene 2005 año
23.373
+17.185
277.73%
1 ene 2006 año
-1.434
-24.806
-106.13%
1 ene 2007 año
13.354
+14.788
-1.03 mil%
1 ene 2008 año
24.37
+11.015
82.48%
1 ene 2009 año
6.258
-18.111
-74.32%
1 ene 2010 año
-35.386
-41.645
-665.43%
1 ene 2011 año
1.397
+36.783
-103.95%
1 ene 2012 año
16.882
+15.485
1.11 mil%
1 ene 2013 año
3.726
-13.156
-77.93%
1 ene 2014 año
-1.914
-5.64
-151.38%
1 ene 2015 año
-1.446
+0.468
-24.47%
1 ene 2016 año
12.786
+14.232
-984.32%
Ranking de los países por los datos estadísticos actuales


Comentarios: