29
/es/
es
AIzaSyAYiBZKx7MnpbEhh9jyipgxe19OcubqV5w
April 1, 2024
41496
Latin America & Caribbean
LCN
false
2
1
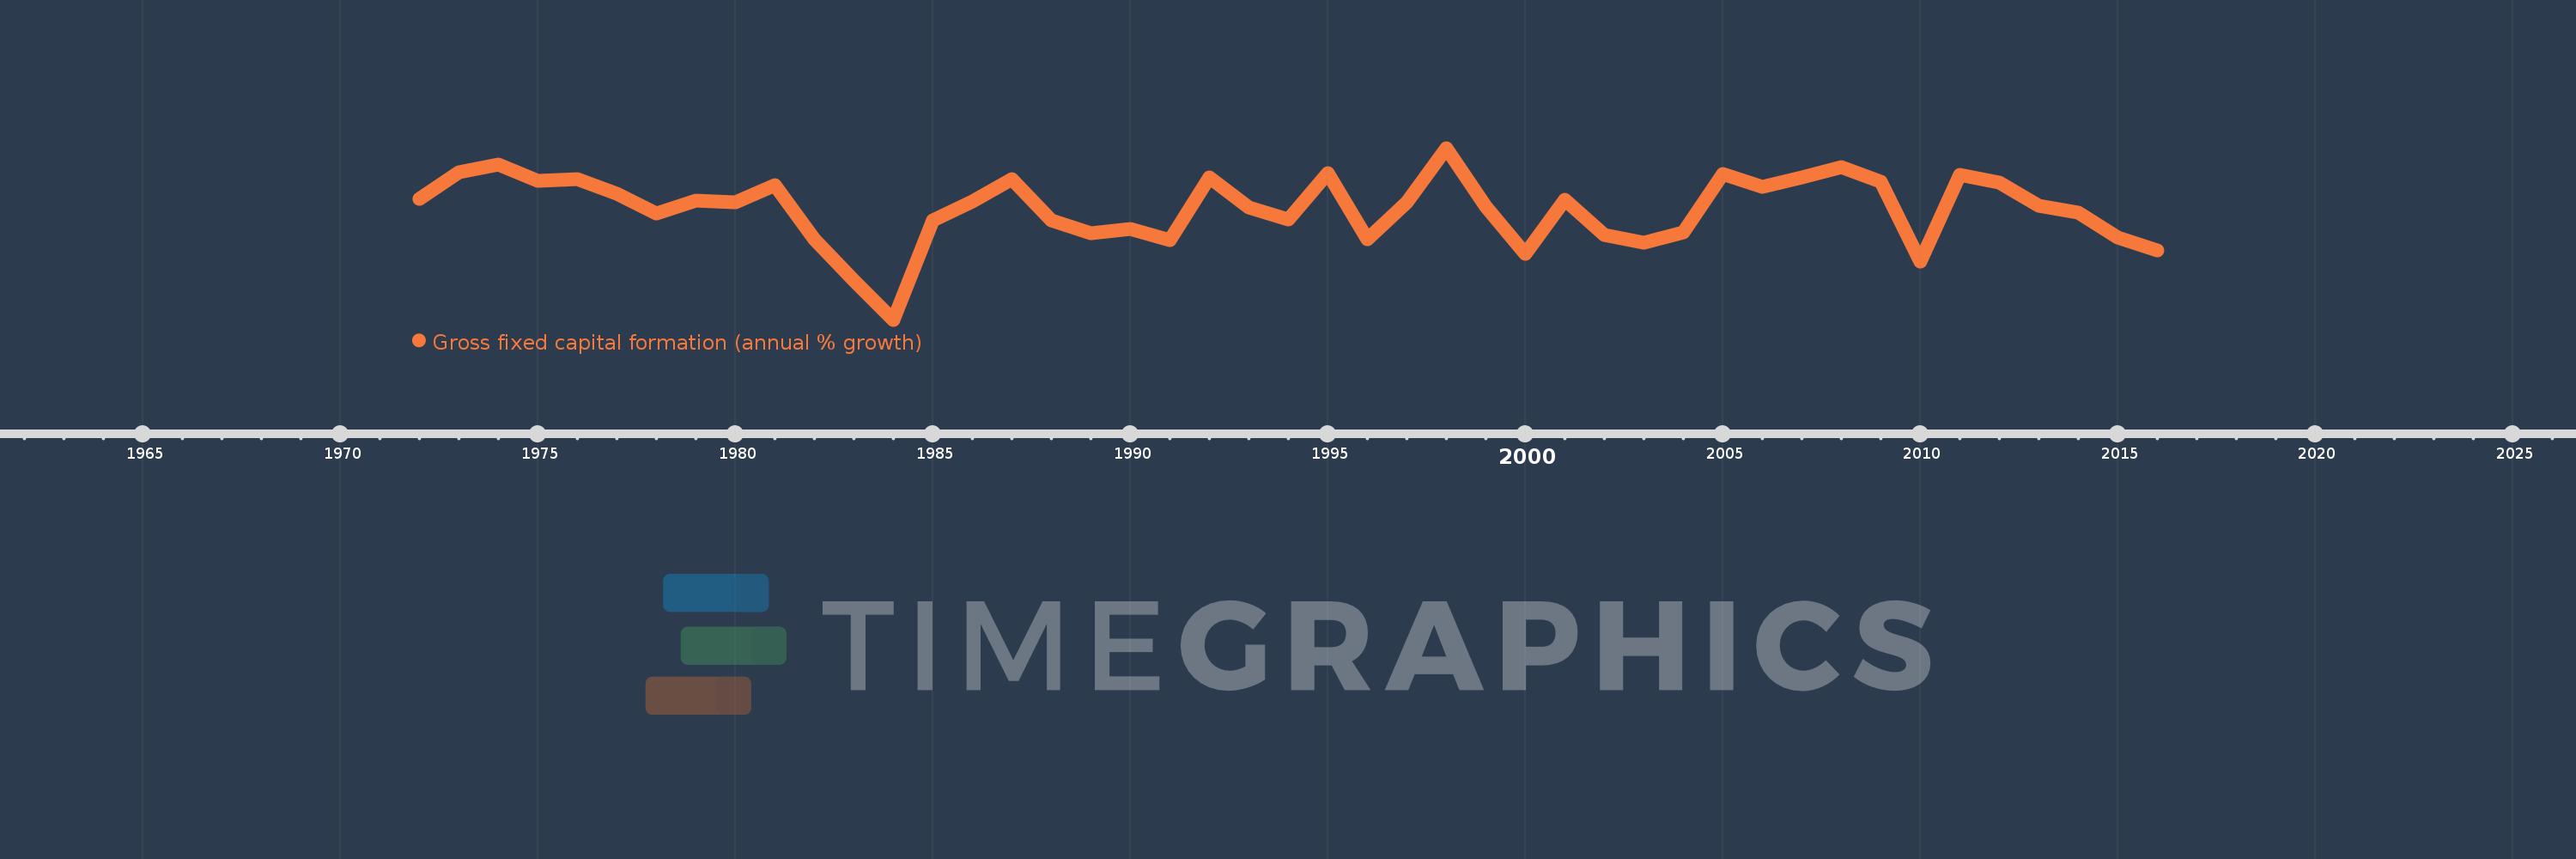
Gross fixed capital formation (annual % growth)
2016,2015,2014,2013,2012,2011,2010,2009,2008,2007,2006,2005,2004,2003,2002,2001,2000,1999,1998,1997,1996,1995,1994,1993,1992,1991,1990,1989,1988,1987,1986,1985,1984,1983,1982,1981,1980,1979,1978,1977,1976,1975,1974,1973,1972
Estas estadísticas en otros países:
AlbaniaAlgeriaAntigua and BarbudaArab WorldArgentinaArmeniaAustraliaAustriaAzerbaijanBahamas, TheBahrainBangladeshBarbadosBelarusBelgiumBelizeBeninBhutanBoliviaBosnia and HerzegovinaBotswanaBrazilBrunei DarussalamBulgariaBurkina FasoBurundiCabo VerdeCambodiaCameroonCanadaCaribbean small statesCentral Europe and the BalticsChadChileChinaColombiaComorosCongo, Dem. Rep.Congo, Rep.Costa RicaCote d'IvoireCroatiaCubaCyprusCzech RepublicDenmarkDjiboutiDominican RepublicEarly-demographic dividendEast Asia & PacificEast Asia & Pacific (excluding high income)East Asia & Pacific (IDA & IBRD countries)EcuadorEgypt, Arab Rep.El SalvadorEquatorial GuineaEritreaEstoniaEthiopiaEuro areaEurope & Central AsiaEurope & Central Asia (excluding high income)Europe & Central Asia (IDA & IBRD countries)European UnionFinlandFranceGabonGambia, TheGeorgiaGermanyGhanaGreeceGuatemalaGuineaGuinea-BissauHaitiHeavily indebted poor countries (HIPC)High incomeHondurasHong Kong SAR, ChinaHungaryIBRD onlyIcelandIDA & IBRD totalIDA blendIDA onlyIDA totalIndiaIndonesiaIran, Islamic Rep.IrelandIsraelItalyJamaicaJapanJordanKazakhstanKenyaKorea, Rep.KosovoKyrgyz RepublicLao PDRLate-demographic dividendLatin America & Caribbean Latin America & Caribbean (excluding high income)Latin America & the Caribbean (IDA & IBRD countries)LatviaLeast developed countries: UN classificationLebanonLiberiaLithuaniaLow & middle incomeLow incomeLower middle incomeLuxembourgMacao SAR, ChinaMacedonia, FYRMadagascarMalawiMalaysiaMaliMaltaMauritaniaMauritiusMexicoMiddle East & North AfricaMiddle East & North Africa (excluding high income)Middle East & North Africa (IDA & IBRD countries)Middle incomeMoldovaMongoliaMontenegroMoroccoMozambiqueNamibiaNepalNetherlandsNew ZealandNicaraguaNigerNigeriaNorth AmericaNorwayOECD membersOmanPakistanPanamaPapua New GuineaParaguayPeruPhilippinesPolandPortugalPost-demographic dividendPre-demographic dividendPuerto RicoRomaniaRussian FederationRwandaSaudi ArabiaSenegalSerbiaSeychellesSierra LeoneSingaporeSlovak RepublicSloveniaSomaliaSouth AfricaSouth AsiaSouth Asia (IDA & IBRD)South SudanSpainSri LankaSub-Saharan Africa Sub-Saharan Africa (excluding high income)Sub-Saharan Africa (IDA & IBRD countries)SudanSurinameSwazilandSwedenSwitzerlandSyrian Arab RepublicTajikistanTanzaniaThailandTimor-LesteTogoTrinidad and TobagoTunisiaTurkeyUgandaUkraineUnited Arab EmiratesUnited KingdomUnited StatesUpper middle incomeUruguayUzbekistanVanuatuVenezuela, RBVietnamWest Bank and GazaWorldZimbabwe línea de tiempo (timeline):
En esta escala de tiempo se presenta un gráfico de 1972 y 2016 de Latin America & Caribbean . Los datos de 1971 están ausentes. El número de observaciones reales por fecha: 45.
Fuente (nombre):
Indicadores del desarrollo mundial
Fuente (organización):
World Bank national accounts data, and OECD National Accounts data files.
Categorías:
Economy & Growth
Se ha actualizado:
23 abr 2017 año
Los indicadores de los cambios de valor en los últimos años
Mínimo:
-18.821
1 ene 1984 año
Máximo:
16.007
1 ene 1998 año
A la fecha de observación
Valor
Cambio absoluto
El cambio con respecto al valor anterior
1 ene 1972 año
5.714
+5.714
0.0%
1 ene 1973 año
11.079
+5.365
93.89%
1 ene 1974 año
12.561
+1.483
13.38%
1 ene 1975 año
9.38
-3.181
-25.32%
1 ene 1976 año
9.61
+0.229
2.44%
1 ene 1977 año
6.795
-2.814
-29.29%
1 ene 1978 año
2.802
-3.994
-58.77%
1 ene 1979 año
5.276
+2.474
88.31%
1 ene 1980 año
4.975
-0.301
-5.7%
1 ene 1981 año
8.423
+3.448
69.31%
1 ene 1982 año
-2.56
-10.982
-130.39%
1 ene 1983 año
-10.794
-8.234
321.71%
1 ene 1984 año
-18.821
-8.027
74.37%
1 ene 1985 año
1.352
+20.173
-107.18%
1 ene 1986 año
5.207
+3.855
285.08%
1 ene 1987 año
9.771
+4.564
87.65%
1 ene 1988 año
1.276
-8.495
-86.94%
1 ene 1989 año
-1.225
-2.501
-196.05%
1 ene 1990 año
-0.349
+0.876
-71.52%
1 ene 1991 año
-2.633
-2.284
654.49%
1 ene 1992 año
9.954
+12.587
-478.07%
1 ene 1993 año
3.874
-6.08
-61.08%
1 ene 1994 año
1.583
-2.291
-59.15%
1 ene 1995 año
10.958
+9.376
592.39%
1 ene 1996 año
-2.557
-13.515
-123.33%
1 ene 1997 año
5.038
+7.595
-297.05%
1 ene 1998 año
16.007
+10.969
217.72%
1 ene 1999 año
4.108
-11.899
-74.33%
1 ene 2000 año
-5.54
-9.649
-234.87%
1 ene 2001 año
5.509
+11.049
-199.43%
1 ene 2002 año
-1.551
-7.06
-128.16%
1 ene 2003 año
-3.146
-1.595
102.81%
1 ene 2004 año
-1.188
+1.958
-62.24%
1 ene 2005 año
10.709
+11.897
-1.0 mil%
1 ene 2006 año
8.083
-2.626
-24.52%
1 ene 2007 año
9.979
+1.896
23.45%
1 ene 2008 año
12.038
+2.059
20.64%
1 ene 2009 año
9.198
-2.84
-23.59%
1 ene 2010 año
-7.011
-16.209
-176.22%
1 ene 2011 año
10.474
+17.484
-249.4%
1 ene 2012 año
9.045
-1.429
-13.64%
1 ene 2013 año
4.28
-4.766
-52.69%
1 ene 2014 año
2.869
-1.411
-32.96%
1 ene 2015 año
-2.098
-4.967
-173.14%
1 ene 2016 año
-4.793
-2.695
128.43%
Ranking de los países por los datos estadísticos actuales


Comentarios: