29
/es/
es
AIzaSyAYiBZKx7MnpbEhh9jyipgxe19OcubqV5w
April 1, 2024
115848
Cuba
CUB
true
2
1
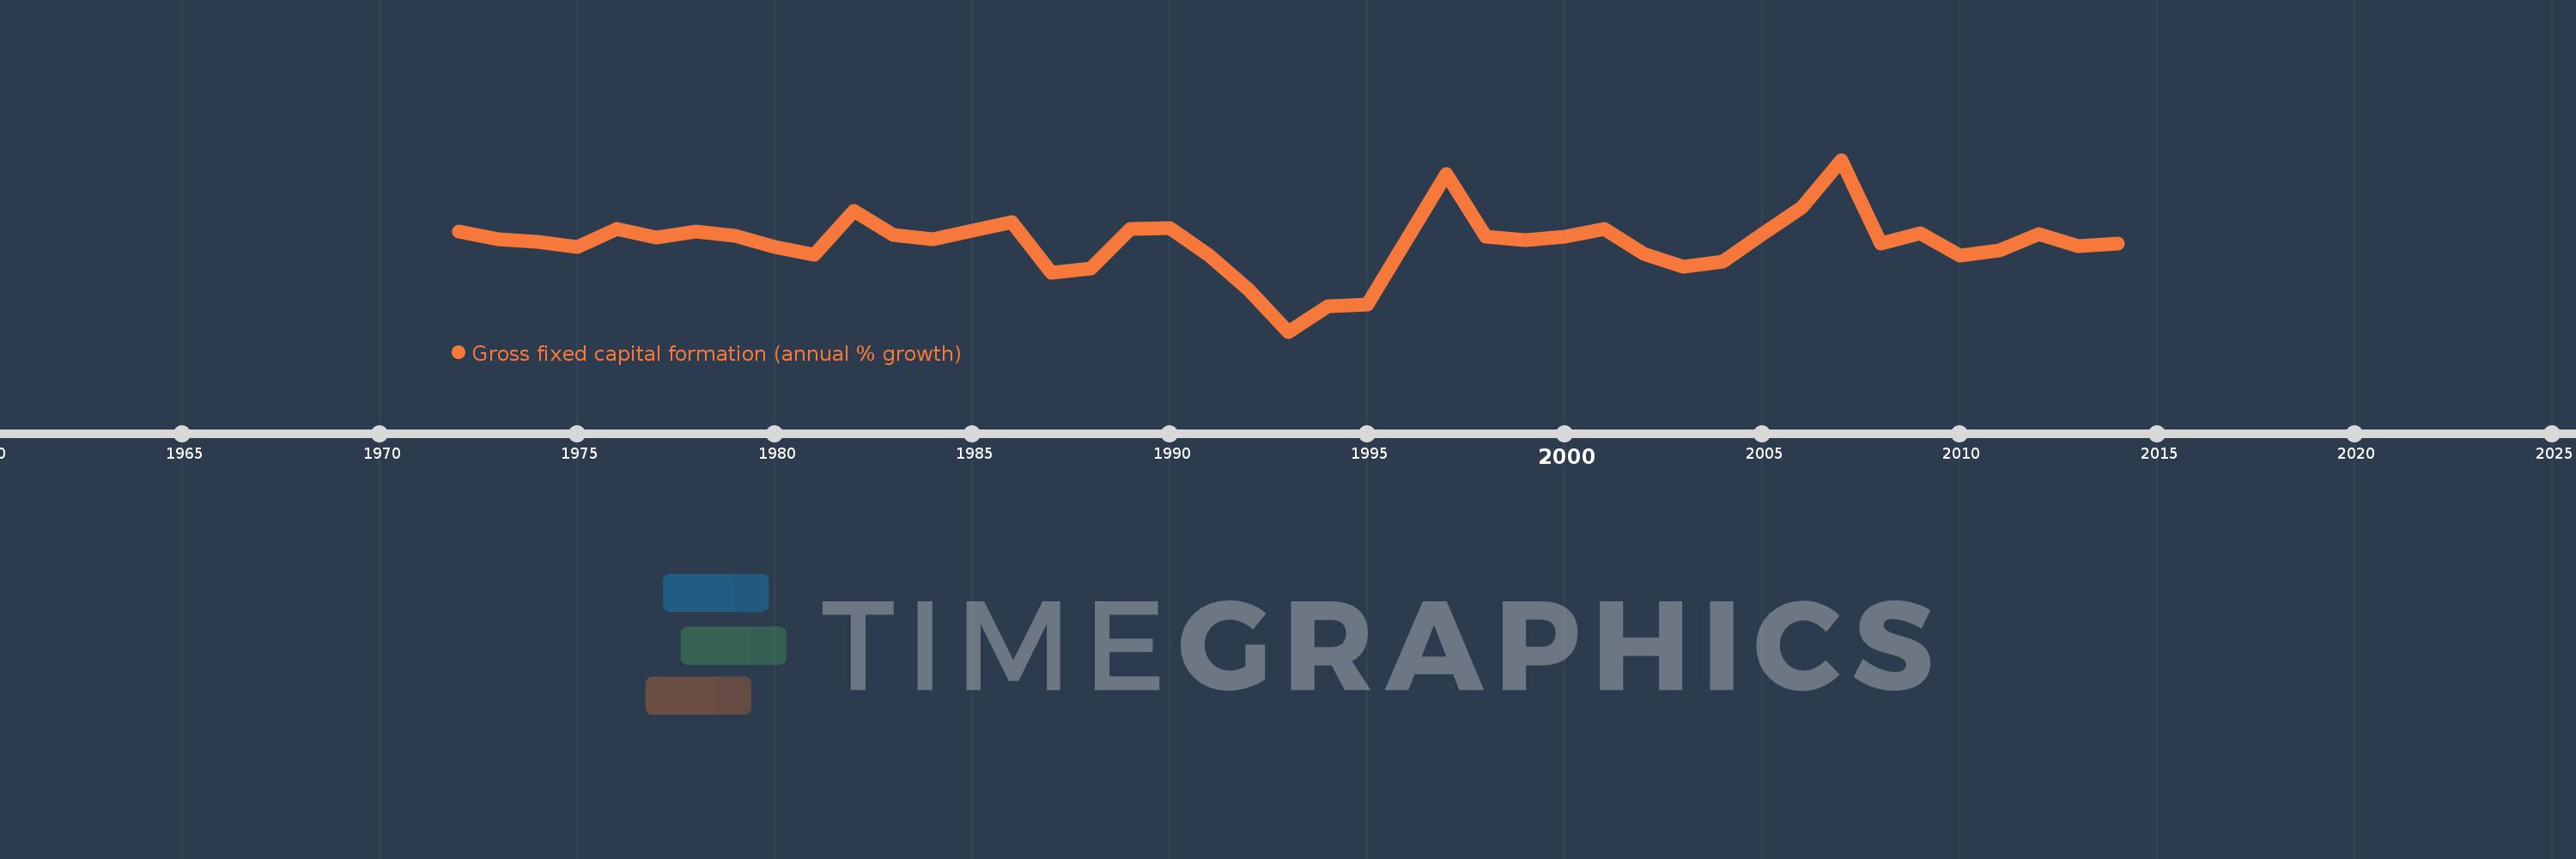
Gross fixed capital formation (annual % growth)
2014,2013,2012,2011,2010,2009,2008,2007,2006,2005,2004,2003,2002,2001,2000,1999,1998,1997,1996,1995,1994,1993,1992,1991,1990,1989,1988,1987,1986,1985,1984,1983,1982,1981,1980,1979,1978,1977,1976,1975,1974,1973,1972
Estas estadísticas en otros países:
AlbaniaAlgeriaAntigua and BarbudaArab WorldArgentinaArmeniaAustraliaAustriaAzerbaijanBahamas, TheBahrainBangladeshBarbadosBelarusBelgiumBelizeBeninBhutanBoliviaBosnia and HerzegovinaBotswanaBrazilBrunei DarussalamBulgariaBurkina FasoBurundiCabo VerdeCambodiaCameroonCanadaCaribbean small statesCentral Europe and the BalticsChadChileChinaColombiaComorosCongo, Dem. Rep.Congo, Rep.Costa RicaCote d'IvoireCroatiaCubaCyprusCzech RepublicDenmarkDjiboutiDominican RepublicEarly-demographic dividendEast Asia & PacificEast Asia & Pacific (excluding high income)East Asia & Pacific (IDA & IBRD countries)EcuadorEgypt, Arab Rep.El SalvadorEquatorial GuineaEritreaEstoniaEthiopiaEuro areaEurope & Central AsiaEurope & Central Asia (excluding high income)Europe & Central Asia (IDA & IBRD countries)European UnionFinlandFranceGabonGambia, TheGeorgiaGermanyGhanaGreeceGuatemalaGuineaGuinea-BissauHaitiHeavily indebted poor countries (HIPC)High incomeHondurasHong Kong SAR, ChinaHungaryIBRD onlyIcelandIDA & IBRD totalIDA blendIDA onlyIDA totalIndiaIndonesiaIran, Islamic Rep.IrelandIsraelItalyJamaicaJapanJordanKazakhstanKenyaKorea, Rep.KosovoKyrgyz RepublicLao PDRLate-demographic dividendLatin America & Caribbean Latin America & Caribbean (excluding high income)Latin America & the Caribbean (IDA & IBRD countries)LatviaLeast developed countries: UN classificationLebanonLiberiaLithuaniaLow & middle incomeLow incomeLower middle incomeLuxembourgMacao SAR, ChinaMacedonia, FYRMadagascarMalawiMalaysiaMaliMaltaMauritaniaMauritiusMexicoMiddle East & North AfricaMiddle East & North Africa (excluding high income)Middle East & North Africa (IDA & IBRD countries)Middle incomeMoldovaMongoliaMontenegroMoroccoMozambiqueNamibiaNepalNetherlandsNew ZealandNicaraguaNigerNigeriaNorth AmericaNorwayOECD membersOmanPakistanPanamaPapua New GuineaParaguayPeruPhilippinesPolandPortugalPost-demographic dividendPre-demographic dividendPuerto RicoRomaniaRussian FederationRwandaSaudi ArabiaSenegalSerbiaSeychellesSierra LeoneSingaporeSlovak RepublicSloveniaSomaliaSouth AfricaSouth AsiaSouth Asia (IDA & IBRD)South SudanSpainSri LankaSub-Saharan Africa Sub-Saharan Africa (excluding high income)Sub-Saharan Africa (IDA & IBRD countries)SudanSurinameSwazilandSwedenSwitzerlandSyrian Arab RepublicTajikistanTanzaniaThailandTimor-LesteTogoTrinidad and TobagoTunisiaTurkeyUgandaUkraineUnited Arab EmiratesUnited KingdomUnited StatesUpper middle incomeUruguayUzbekistanVanuatuVenezuela, RBVietnamWest Bank and GazaWorldZimbabwe línea de tiempo (timeline):
En esta escala de tiempo se presenta un gráfico de 1972 y 2014 de Cuba. Los datos de 1971 están ausentes. El número de observaciones reales por fecha: 43.
Fuente (nombre):
Indicadores del desarrollo mundial
Fuente (organización):
World Bank national accounts data, and OECD National Accounts data files.
Categorías:
Economy & Growth
Se ha actualizado:
23 abr 2017 año
Los indicadores de los cambios de valor en los últimos años
Mínimo:
-41.267
1 ene 1993 año
Máximo:
44.11
1 ene 2007 año
A la fecha de observación
Valor
Cambio absoluto
El cambio con respecto al valor anterior
1 ene 1972 año
8.619
+8.619
0.0%
1 ene 1973 año
4.812
-3.807
-44.17%
1 ene 1974 año
3.367
-1.444
-30.02%
1 ene 1975 año
0.911
-2.456
-72.94%
1 ene 1976 año
9.734
+8.823
968.34%
1 ene 1977 año
5.51
-4.224
-43.4%
1 ene 1978 año
8.442
+2.932
53.22%
1 ene 1979 año
6.257
-2.185
-25.88%
1 ene 1980 año
0.975
-5.282
-84.42%
1 ene 1981 año
-3.153
-4.128
-423.48%
1 ene 1982 año
18.849
+22.003
-697.74%
1 ene 1983 año
6.897
-11.953
-63.41%
1 ene 1984 año
4.692
-2.205
-31.97%
1 ene 1985 año
8.94
+4.248
90.54%
1 ene 1986 año
13.097
+4.156
46.49%
1 ene 1987 año
-11.834
-24.93
-190.36%
1 ene 1988 año
-10.098
+1.736
-14.67%
1 ene 1989 año
9.845
+19.943
-197.5%
1 ene 1990 año
10.12
+0.275
2.79%
1 ene 1991 año
-3.632
-13.752
-135.89%
1 ene 1992 año
-20.546
-16.914
465.68%
1 ene 1993 año
-41.267
-20.721
100.85%
1 ene 1994 año
-28.855
+12.411
-30.08%
1 ene 1995 año
-27.642
+1.213
-4.2%
1 ene 1996 año
4.803
+32.446
-117.38%
1 ene 1997 año
37.066
+32.263
671.7%
1 ene 1998 año
5.713
-31.353
-84.59%
1 ene 1999 año
4.263
-1.45
-25.38%
1 ene 2000 año
5.731
+1.468
34.43%
1 ene 2001 año
9.568
+3.837
66.95%
1 ene 2002 año
-2.838
-12.405
-129.66%
1 ene 2003 año
-8.93
-6.092
214.71%
1 ene 2004 año
-6.643
+2.287
-25.61%
1 ene 2005 año
7.23
+13.873
-208.84%
1 ene 2006 año
20.575
+13.346
184.59%
1 ene 2007 año
44.11
+23.535
114.38%
1 ene 2008 año
2.414
-41.696
-94.53%
1 ene 2009 año
7.613
+5.199
215.35%
1 ene 2010 año
-3.354
-10.966
-144.05%
1 ene 2011 año
-0.728
+2.626
-78.31%
1 ene 2012 año
7.13
+7.857
-1.08 mil%
1 ene 2013 año
1.275
-5.854
-82.12%
1 ene 2014 año
2.456
+1.181
92.59%
Ranking de los países por los datos estadísticos actuales


Comentarios: