29
/es/
es
AIzaSyAYiBZKx7MnpbEhh9jyipgxe19OcubqV5w
April 1, 2024
99878
Cameroon
CMR
true
2
1
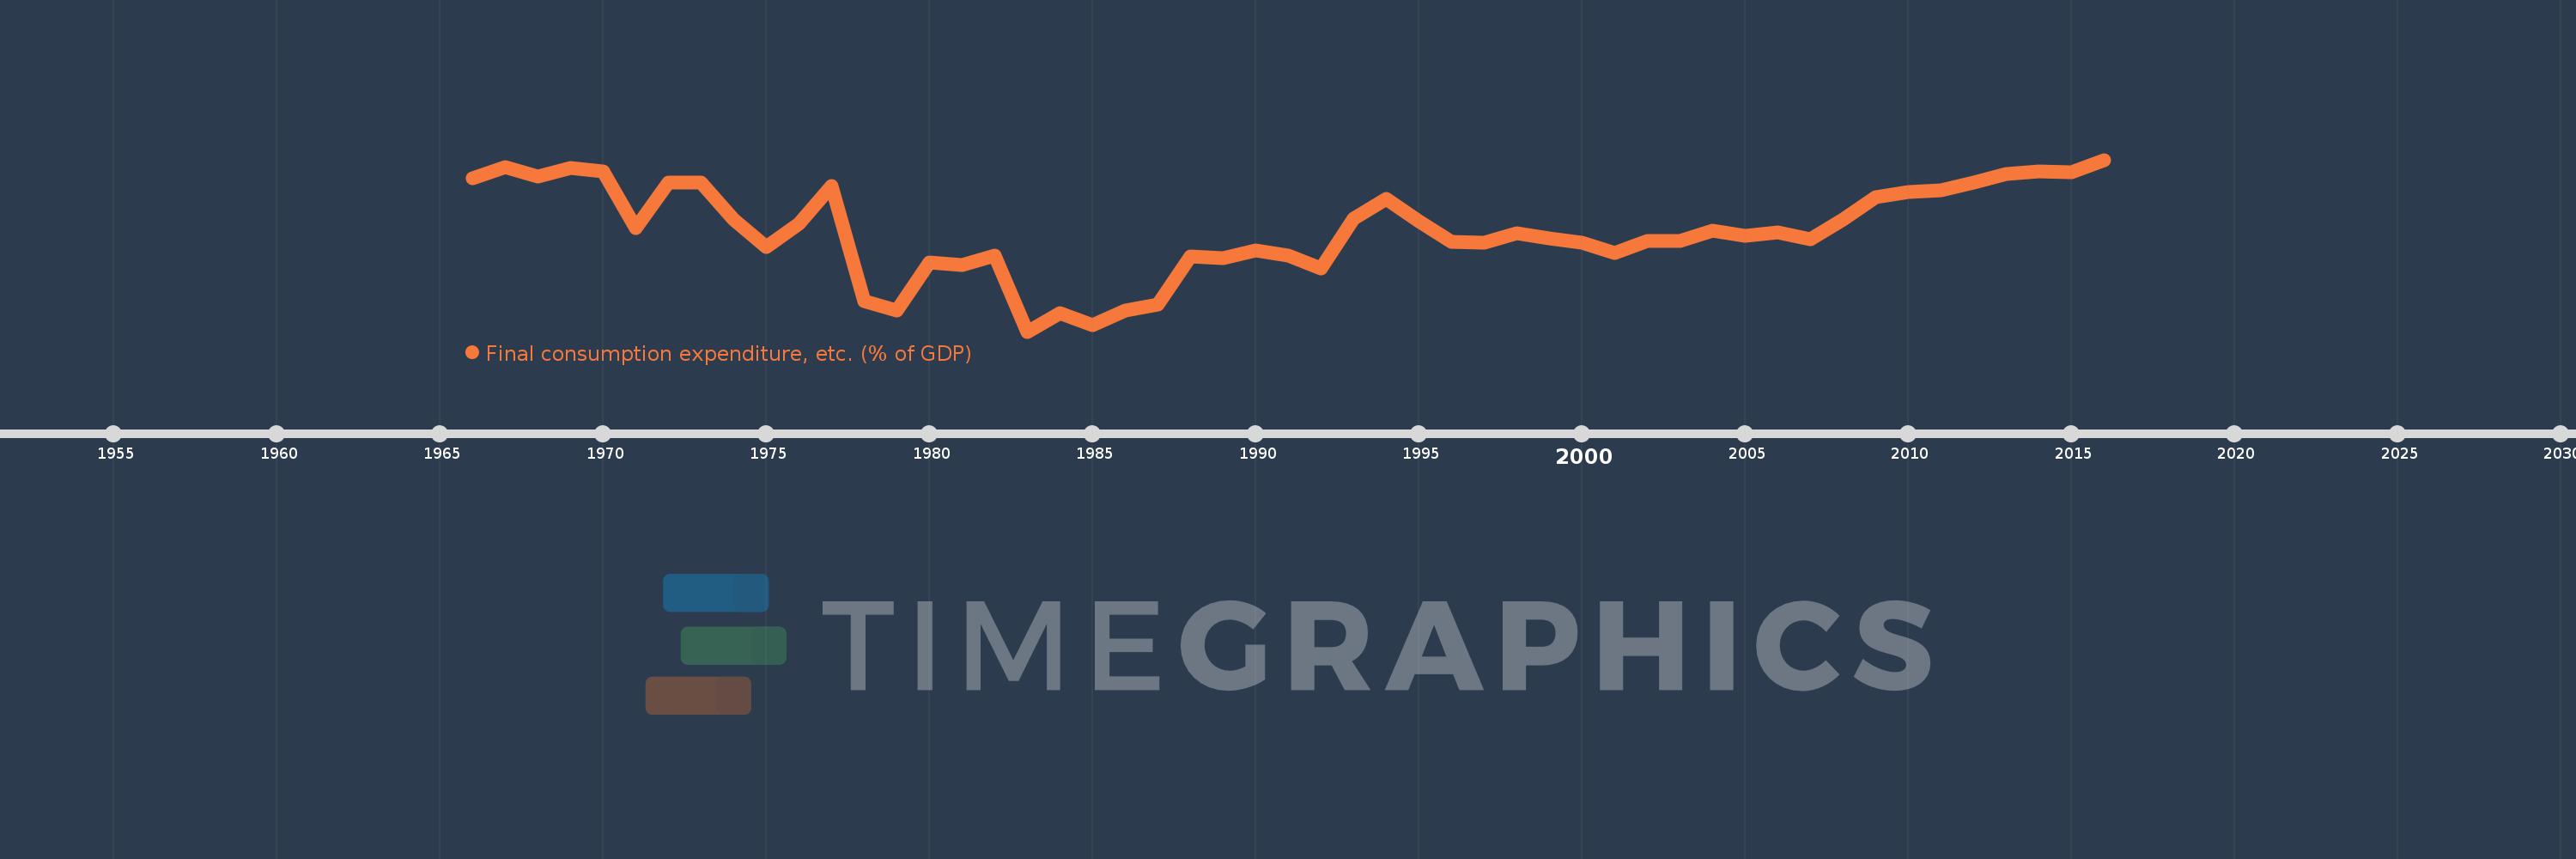
Final consumption expenditure, etc. (% of GDP)
2016,2015,2014,2013,2012,2011,2010,2009,2008,2007,2006,2005,2004,2003,2002,2001,2000,1999,1998,1997,1996,1995,1994,1993,1992,1991,1990,1989,1988,1987,1986,1985,1984,1983,1982,1981,1980,1979,1978,1977,1976,1975,1974,1973,1972,1971,1970,1969,1968,1967,1966
Estas estadísticas en otros países:
AfghanistanAlbaniaAlgeriaAngolaAntigua and BarbudaArgentinaArmeniaArubaAustraliaAustriaAzerbaijanBahamas, TheBahrainBangladeshBarbadosBelarusBelgiumBelizeBeninBermudaBhutanBoliviaBosnia and HerzegovinaBotswanaBrazilBrunei DarussalamBulgariaBurkina FasoBurundiCabo VerdeCambodiaCameroonCanadaCentral African RepublicChadChileChinaColombiaComorosCongo, Dem. Rep.Congo, Rep.Costa RicaCote d'IvoireCroatiaCubaCyprusCzech RepublicDenmarkDjiboutiDominicaDominican RepublicEcuadorEgypt, Arab Rep.El SalvadorEquatorial GuineaEritreaEstoniaEthiopiaFaroe IslandsFijiFinlandFranceGabonGambia, TheGeorgiaGermanyGhanaGreeceGrenadaGuatemalaGuineaGuinea-BissauGuyanaHaitiHondurasHong Kong SAR, ChinaHungaryIcelandIndiaIndonesiaIran, Islamic Rep.IraqIrelandIsraelItalyJamaicaJapanJordanKazakhstanKenyaKiribatiKorea, Rep.KosovoKuwaitKyrgyz RepublicLao PDRLatviaLebanonLesothoLiberiaLibyaLithuaniaLuxembourgMacao SAR, ChinaMacedonia, FYRMadagascarMalawiMalaysiaMaldivesMaliMaltaMauritaniaMauritiusMexicoMicronesia, Fed. Sts.MoldovaMongoliaMontenegroMoroccoMozambiqueNamibiaNepalNetherlandsNew CaledoniaNew ZealandNicaraguaNigerNigeriaNorwayOmanPakistanPanamaPapua New GuineaParaguayPeruPhilippinesPolandPortugalPuerto RicoQatarRomaniaRussian FederationRwandaSaudi ArabiaSenegalSerbiaSeychellesSierra LeoneSingaporeSlovak RepublicSloveniaSolomon IslandsSomaliaSouth AfricaSouth SudanSpainSri LankaSt. Kitts and NevisSt. LuciaSt. Vincent and the GrenadinesSudanSurinameSwazilandSwedenSwitzerlandSyrian Arab RepublicTajikistanTanzaniaThailandTimor-LesteTogoTongaTrinidad and TobagoTunisiaTurkeyTurkmenistanUgandaUkraineUnited Arab EmiratesUnited KingdomUnited StatesUruguayUzbekistanVanuatuVenezuela, RBVietnamWest Bank and GazaYemen, Rep.ZambiaZimbabwe línea de tiempo (timeline):
En esta escala de tiempo se presenta un gráfico de 1966 y 2016 de Cameroon. Los datos de 1965 están ausentes. El número de observaciones reales por fecha: 51.
Fuente (nombre):
Indicadores del desarrollo mundial
Fuente (organización):
World Bank national accounts data, and OECD National Accounts data files.
Categorías:
Economy & Growth
Se ha actualizado:
23 abr 2017 año
Los indicadores de los cambios de valor en los últimos años
Mínimo:
70.9
1 ene 1983 año
Máximo:
90.024
1 ene 2016 año
A la fecha de observación
Valor
Cambio absoluto
El cambio con respecto al valor anterior
1 ene 1966 año
87.97
+87.97
0.0%
1 ene 1967 año
89.24
+1.27
1.44%
1 ene 1968 año
88.189
-1.05
-1.18%
1 ene 1969 año
89.151
+0.961
1.09%
1 ene 1970 año
88.78
-0.37
-0.42%
1 ene 1971 año
82.432
-6.348
-7.15%
1 ene 1972 año
87.493
+5.06
6.14%
1 ene 1973 año
87.447
-0.046
-0.05%
1 ene 1974 año
83.412
-4.035
-4.61%
1 ene 1975 año
80.281
-3.131
-3.75%
1 ene 1976 año
82.884
+2.603
3.24%
1 ene 1977 año
87.134
+4.249
5.13%
1 ene 1978 año
74.257
-12.877
-14.78%
1 ene 1979 año
73.218
-1.039
-1.4%
1 ene 1980 año
78.643
+5.425
7.41%
1 ene 1981 año
78.264
-0.38
-0.48%
1 ene 1982 año
79.359
+1.096
1.4%
1 ene 1983 año
70.9
-8.459
-10.66%
1 ene 1984 año
72.928
+2.028
2.86%
1 ene 1985 año
71.571
-1.357
-1.86%
1 ene 1986 año
73.242
+1.671
2.33%
1 ene 1987 año
73.93
+0.688
0.94%
1 ene 1988 año
79.232
+5.302
7.17%
1 ene 1989 año
79.031
-0.201
-0.25%
1 ene 1990 año
79.966
+0.935
1.18%
1 ene 1991 año
79.319
-0.648
-0.81%
1 ene 1992 año
77.968
-1.35
-1.7%
1 ene 1993 año
83.463
+5.495
7.05%
1 ene 1994 año
85.715
+2.251
2.7%
1 ene 1995 año
83.212
-2.503
-2.92%
1 ene 1996 año
80.922
-2.289
-2.75%
1 ene 1997 año
80.77
-0.152
-0.19%
1 ene 1998 año
81.801
+1.031
1.28%
1 ene 1999 año
81.23
-0.571
-0.7%
1 ene 2000 año
80.803
-0.428
-0.53%
1 ene 2001 año
79.688
-1.115
-1.38%
1 ene 2002 año
80.983
+1.295
1.63%
1 ene 2003 año
80.994
+0.011
0.01%
1 ene 2004 año
82.176
+1.182
1.46%
1 ene 2005 año
81.521
-0.656
-0.8%
1 ene 2006 año
81.949
+0.428
0.53%
1 ene 2007 año
81.134
-0.815
-0.99%
1 ene 2008 año
83.369
+2.235
2.76%
1 ene 2009 año
85.864
+2.495
2.99%
1 ene 2010 año
86.474
+0.61
0.71%
1 ene 2011 año
86.624
+0.149
0.17%
1 ene 2012 año
87.491
+0.868
1.0%
1 ene 2013 año
88.435
+0.944
1.08%
1 ene 2014 año
88.747
+0.312
0.35%
1 ene 2015 año
88.679
-0.068
-0.08%
1 ene 2016 año
90.024
+1.344
1.52%
Ranking de los países por los datos estadísticos actuales


Comentarios: