29
/es/
es
AIzaSyAYiBZKx7MnpbEhh9jyipgxe19OcubqV5w
April 1, 2024
161432
Italy
ITA
true
2
1
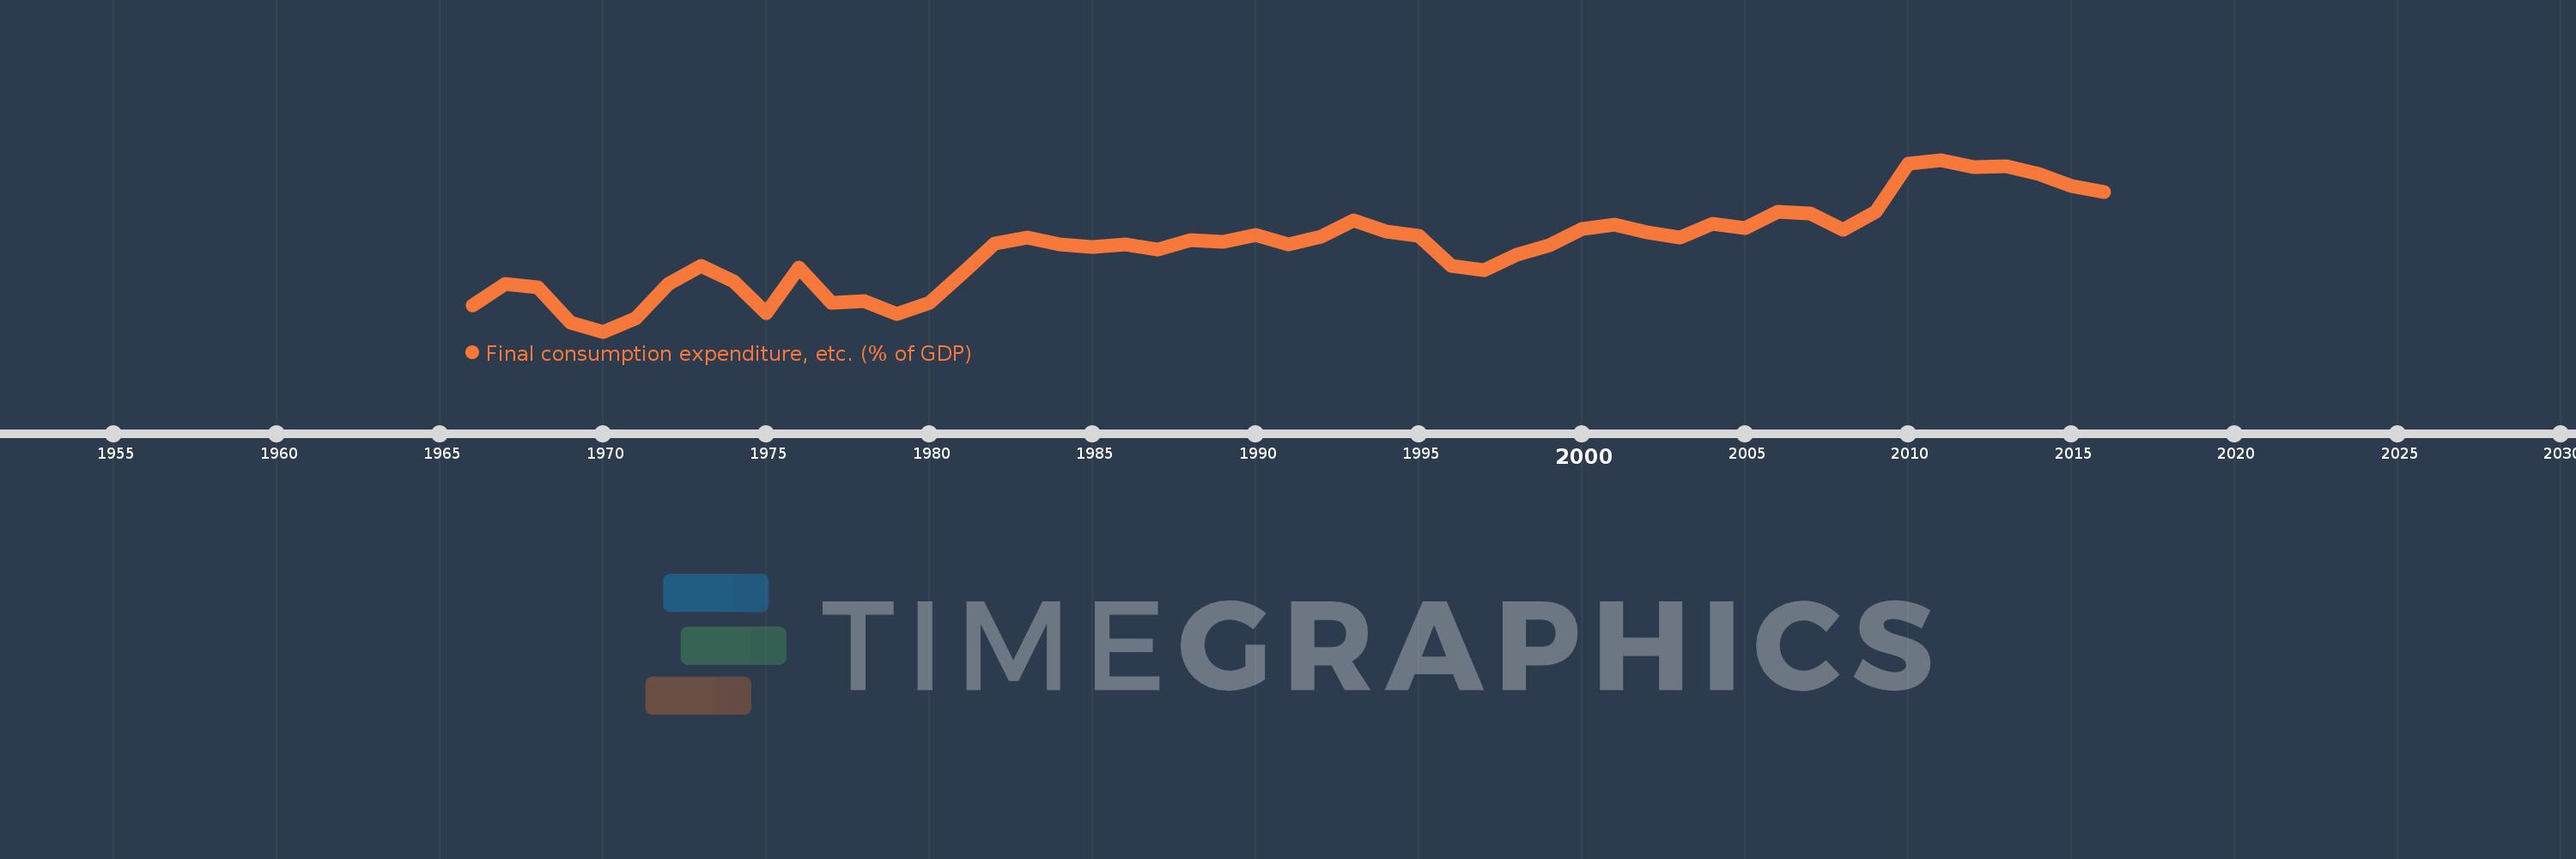
Final consumption expenditure, etc. (% of GDP)
2016,2015,2014,2013,2012,2011,2010,2009,2008,2007,2006,2005,2004,2003,2002,2001,2000,1999,1998,1997,1996,1995,1994,1993,1992,1991,1990,1989,1988,1987,1986,1985,1984,1983,1982,1981,1980,1979,1978,1977,1976,1975,1974,1973,1972,1971,1970,1969,1968,1967,1966
Estas estadísticas en otros países:
AfghanistanAlbaniaAlgeriaAngolaAntigua and BarbudaArgentinaArmeniaArubaAustraliaAustriaAzerbaijanBahamas, TheBahrainBangladeshBarbadosBelarusBelgiumBelizeBeninBermudaBhutanBoliviaBosnia and HerzegovinaBotswanaBrazilBrunei DarussalamBulgariaBurkina FasoBurundiCabo VerdeCambodiaCameroonCanadaCentral African RepublicChadChileChinaColombiaComorosCongo, Dem. Rep.Congo, Rep.Costa RicaCote d'IvoireCroatiaCubaCyprusCzech RepublicDenmarkDjiboutiDominicaDominican RepublicEcuadorEgypt, Arab Rep.El SalvadorEquatorial GuineaEritreaEstoniaEthiopiaFaroe IslandsFijiFinlandFranceGabonGambia, TheGeorgiaGermanyGhanaGreeceGrenadaGuatemalaGuineaGuinea-BissauGuyanaHaitiHondurasHong Kong SAR, ChinaHungaryIcelandIndiaIndonesiaIran, Islamic Rep.IraqIrelandIsraelItalyJamaicaJapanJordanKazakhstanKenyaKiribatiKorea, Rep.KosovoKuwaitKyrgyz RepublicLao PDRLatviaLebanonLesothoLiberiaLibyaLithuaniaLuxembourgMacao SAR, ChinaMacedonia, FYRMadagascarMalawiMalaysiaMaldivesMaliMaltaMauritaniaMauritiusMexicoMicronesia, Fed. Sts.MoldovaMongoliaMontenegroMoroccoMozambiqueNamibiaNepalNetherlandsNew CaledoniaNew ZealandNicaraguaNigerNigeriaNorwayOmanPakistanPanamaPapua New GuineaParaguayPeruPhilippinesPolandPortugalPuerto RicoQatarRomaniaRussian FederationRwandaSaudi ArabiaSenegalSerbiaSeychellesSierra LeoneSingaporeSlovak RepublicSloveniaSolomon IslandsSomaliaSouth AfricaSouth SudanSpainSri LankaSt. Kitts and NevisSt. LuciaSt. Vincent and the GrenadinesSudanSurinameSwazilandSwedenSwitzerlandSyrian Arab RepublicTajikistanTanzaniaThailandTimor-LesteTogoTongaTrinidad and TobagoTunisiaTurkeyTurkmenistanUgandaUkraineUnited Arab EmiratesUnited KingdomUnited StatesUruguayUzbekistanVanuatuVenezuela, RBVietnamWest Bank and GazaYemen, Rep.ZambiaZimbabwe línea de tiempo (timeline):
En esta escala de tiempo se presenta un gráfico de 1966 y 2016 de Italy. Los datos de 1965 están ausentes. El número de observaciones reales por fecha: 51.
Fuente (nombre):
Indicadores del desarrollo mundial
Fuente (organización):
World Bank national accounts data, and OECD National Accounts data files.
Categorías:
Economy & Growth
Se ha actualizado:
23 abr 2017 año
Los indicadores de los cambios de valor en los últimos años
Mínimo:
73.463
1 ene 1970 año
Máximo:
81.431
1 ene 2011 año
A la fecha de observación
Valor
Cambio absoluto
El cambio con respecto al valor anterior
1 ene 1966 año
74.691
+74.691
0.0%
1 ene 1967 año
75.686
+0.994
1.33%
1 ene 1968 año
75.506
-0.18
-0.24%
1 ene 1969 año
73.887
-1.619
-2.14%
1 ene 1970 año
73.463
-0.424
-0.57%
1 ene 1971 año
74.061
+0.597
0.81%
1 ene 1972 año
75.67
+1.61
2.17%
1 ene 1973 año
76.518
+0.848
1.12%
1 ene 1974 año
75.8
-0.718
-0.94%
1 ene 1975 año
74.334
-1.466
-1.93%
1 ene 1976 año
76.428
+2.095
2.82%
1 ene 1977 año
74.81
-1.618
-2.12%
1 ene 1978 año
74.883
+0.072
0.1%
1 ene 1979 año
74.287
-0.595
-0.79%
1 ene 1980 año
74.792
+0.505
0.68%
1 ene 1981 año
76.145
+1.352
1.81%
1 ene 1982 año
77.544
+1.399
1.84%
1 ene 1983 año
77.807
+0.263
0.34%
1 ene 1984 año
77.526
-0.281
-0.36%
1 ene 1985 año
77.38
-0.146
-0.19%
1 ene 1986 año
77.505
+0.125
0.16%
1 ene 1987 año
77.25
-0.255
-0.33%
1 ene 1988 año
77.716
+0.466
0.6%
1 ene 1989 año
77.632
-0.084
-0.11%
1 ene 1990 año
77.944
+0.312
0.4%
1 ene 1991 año
77.5
-0.444
-0.57%
1 ene 1992 año
77.859
+0.359
0.46%
1 ene 1993 año
78.632
+0.773
0.99%
1 ene 1994 año
78.095
-0.537
-0.68%
1 ene 1995 año
77.91
-0.185
-0.24%
1 ene 1996 año
76.513
-1.398
-1.79%
1 ene 1997 año
76.32
-0.193
-0.25%
1 ene 1998 año
77.012
+0.692
0.91%
1 ene 1999 año
77.476
+0.464
0.6%
1 ene 2000 año
78.219
+0.744
0.96%
1 ene 2001 año
78.442
+0.222
0.28%
1 ene 2002 año
78.075
-0.366
-0.47%
1 ene 2003 año
77.837
-0.238
-0.3%
1 ene 2004 año
78.482
+0.644
0.83%
1 ene 2005 año
78.247
-0.235
-0.3%
1 ene 2006 año
79.007
+0.76
0.97%
1 ene 2007 año
78.942
-0.065
-0.08%
1 ene 2008 año
78.174
-0.769
-0.97%
1 ene 2009 año
79.008
+0.834
1.07%
1 ene 2010 año
81.263
+2.256
2.86%
1 ene 2011 año
81.431
+0.168
0.21%
1 ene 2012 año
81.108
-0.323
-0.4%
1 ene 2013 año
81.151
+0.042
0.05%
1 ene 2014 año
80.786
-0.364
-0.45%
1 ene 2015 año
80.235
-0.551
-0.68%
1 ene 2016 año
79.93
-0.305
-0.38%
Ranking de los países por los datos estadísticos actuales


Comentarios: