29
/es/
es
AIzaSyAYiBZKx7MnpbEhh9jyipgxe19OcubqV5w
April 1, 2024
249838
St. Kitts and Nevis
KNA
true
2
1
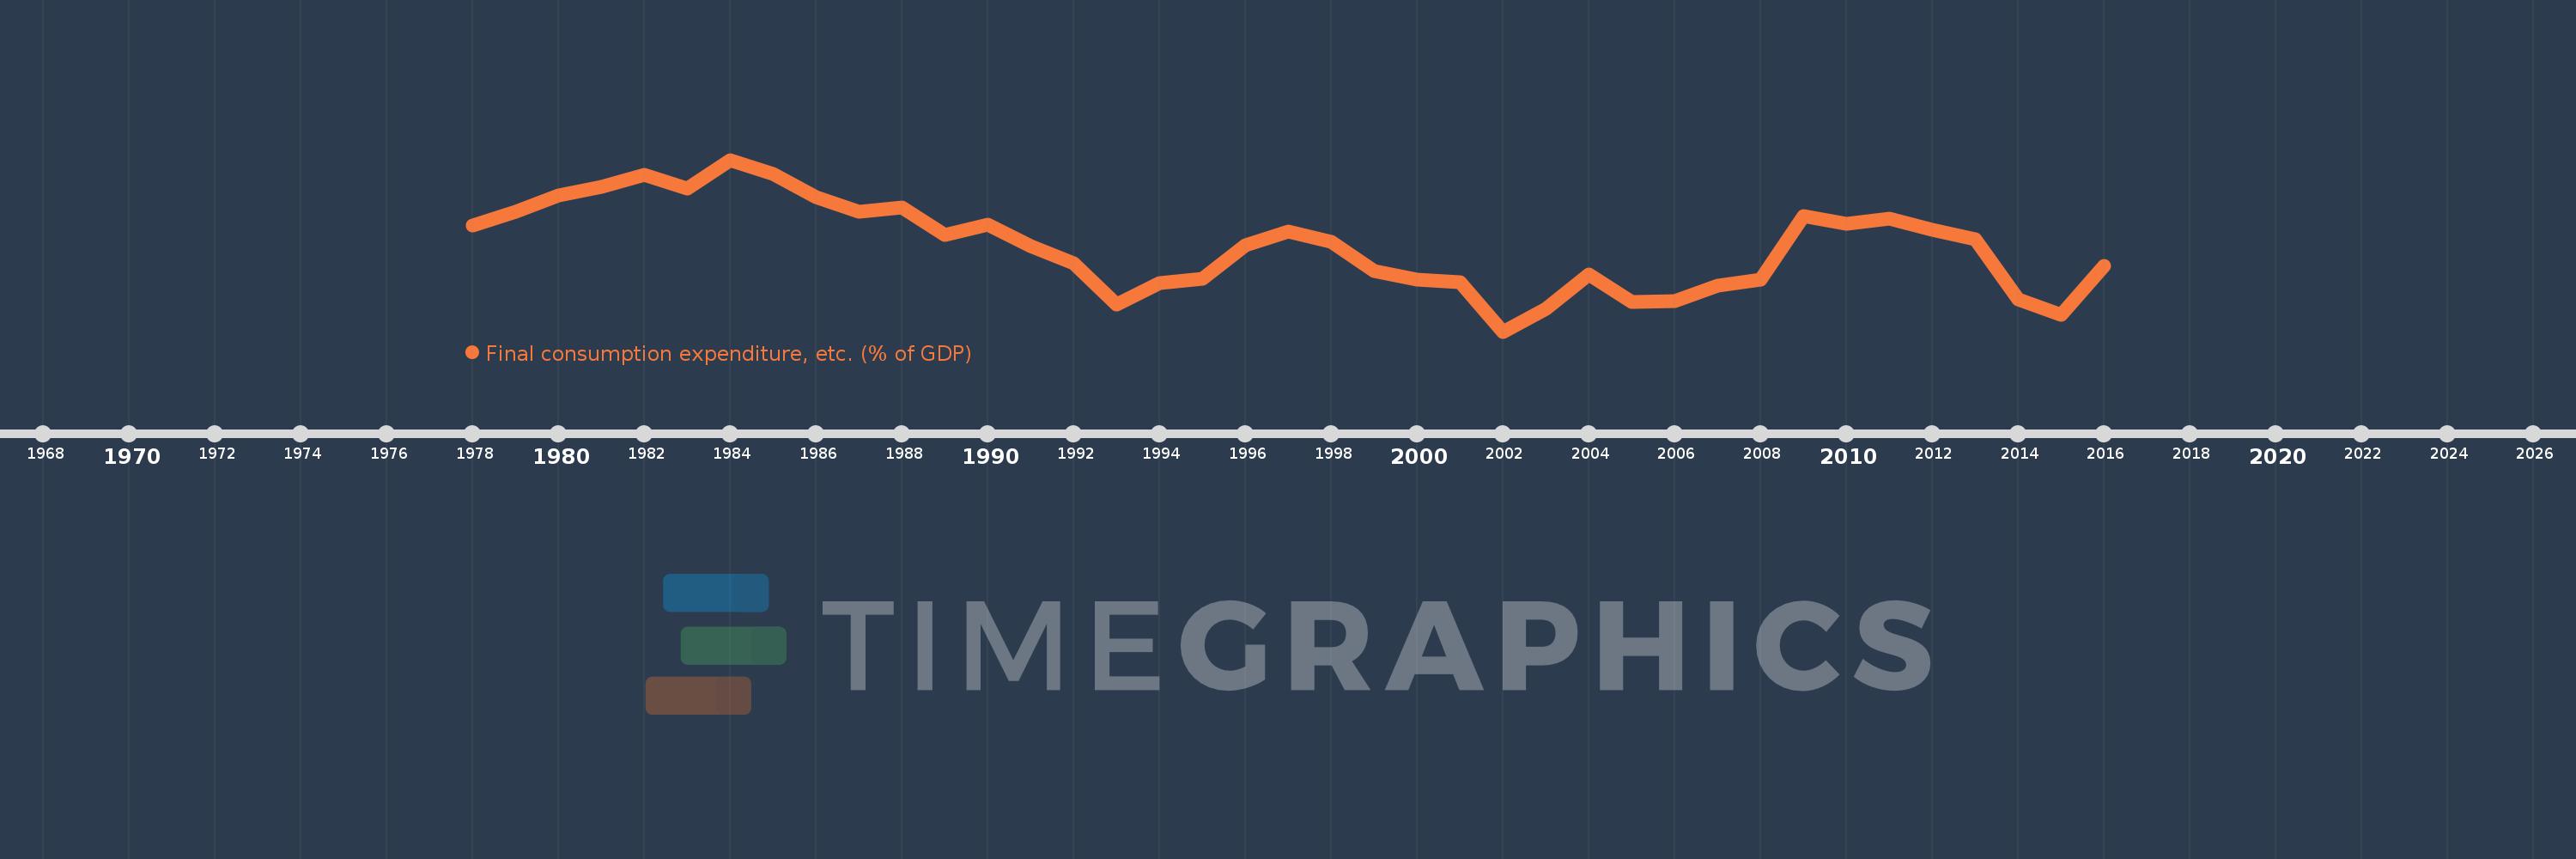
Final consumption expenditure, etc. (% of GDP)
2016,2015,2014,2013,2012,2011,2010,2009,2008,2007,2006,2005,2004,2003,2002,2001,2000,1999,1998,1997,1996,1995,1994,1993,1992,1991,1990,1989,1988,1987,1986,1985,1984,1983,1982,1981,1980,1979,1978
Estas estadísticas en otros países:
AfghanistanAlbaniaAlgeriaAngolaAntigua and BarbudaArgentinaArmeniaArubaAustraliaAustriaAzerbaijanBahamas, TheBahrainBangladeshBarbadosBelarusBelgiumBelizeBeninBermudaBhutanBoliviaBosnia and HerzegovinaBotswanaBrazilBrunei DarussalamBulgariaBurkina FasoBurundiCabo VerdeCambodiaCameroonCanadaCentral African RepublicChadChileChinaColombiaComorosCongo, Dem. Rep.Congo, Rep.Costa RicaCote d'IvoireCroatiaCubaCyprusCzech RepublicDenmarkDjiboutiDominicaDominican RepublicEcuadorEgypt, Arab Rep.El SalvadorEquatorial GuineaEritreaEstoniaEthiopiaFaroe IslandsFijiFinlandFranceGabonGambia, TheGeorgiaGermanyGhanaGreeceGrenadaGuatemalaGuineaGuinea-BissauGuyanaHaitiHondurasHong Kong SAR, ChinaHungaryIcelandIndiaIndonesiaIran, Islamic Rep.IraqIrelandIsraelItalyJamaicaJapanJordanKazakhstanKenyaKiribatiKorea, Rep.KosovoKuwaitKyrgyz RepublicLao PDRLatviaLebanonLesothoLiberiaLibyaLithuaniaLuxembourgMacao SAR, ChinaMacedonia, FYRMadagascarMalawiMalaysiaMaldivesMaliMaltaMauritaniaMauritiusMexicoMicronesia, Fed. Sts.MoldovaMongoliaMontenegroMoroccoMozambiqueNamibiaNepalNetherlandsNew CaledoniaNew ZealandNicaraguaNigerNigeriaNorwayOmanPakistanPanamaPapua New GuineaParaguayPeruPhilippinesPolandPortugalPuerto RicoQatarRomaniaRussian FederationRwandaSaudi ArabiaSenegalSerbiaSeychellesSierra LeoneSingaporeSlovak RepublicSloveniaSolomon IslandsSomaliaSouth AfricaSouth SudanSpainSri LankaSt. Kitts and NevisSt. LuciaSt. Vincent and the GrenadinesSudanSurinameSwazilandSwedenSwitzerlandSyrian Arab RepublicTajikistanTanzaniaThailandTimor-LesteTogoTongaTrinidad and TobagoTunisiaTurkeyTurkmenistanUgandaUkraineUnited Arab EmiratesUnited KingdomUnited StatesUruguayUzbekistanVanuatuVenezuela, RBVietnamWest Bank and GazaYemen, Rep.ZambiaZimbabwe línea de tiempo (timeline):
En esta escala de tiempo se presenta un gráfico de 1978 y 2016 de St. Kitts and Nevis. Los datos de 1977 están ausentes. El número de observaciones reales por fecha: 39.
Fuente (nombre):
Indicadores del desarrollo mundial
Fuente (organización):
World Bank national accounts data, and OECD National Accounts data files.
Categorías:
Economy & Growth
Se ha actualizado:
23 abr 2017 año
Los indicadores de los cambios de valor en los últimos años
Mínimo:
60.535
1 ene 2002 año
Máximo:
100.17
1 ene 1984 año
A la fecha de observación
Valor
Cambio absoluto
El cambio con respecto al valor anterior
1 ene 1978 año
85.029
+85.029
0.0%
1 ene 1979 año
88.224
+3.195
3.76%
1 ene 1980 año
91.919
+3.695
4.19%
1 ene 1981 año
93.912
+1.994
2.17%
1 ene 1982 año
96.607
+2.694
2.87%
1 ene 1983 año
93.434
-3.173
-3.28%
1 ene 1984 año
100.17
+6.736
7.21%
1 ene 1985 año
96.918
-3.252
-3.25%
1 ene 1986 año
91.535
-5.383
-5.55%
1 ene 1987 año
88.263
-3.272
-3.57%
1 ene 1988 año
89.095
+0.832
0.94%
1 ene 1989 año
82.818
-6.276
-7.04%
1 ene 1990 año
85.187
+2.368
2.86%
1 ene 1991 año
80.286
-4.901
-5.75%
1 ene 1992 año
76.237
-4.049
-5.04%
1 ene 1993 año
66.727
-9.51
-12.47%
1 ene 1994 año
71.802
+5.075
7.61%
1 ene 1995 año
72.727
+0.925
1.29%
1 ene 1996 año
80.377
+7.649
10.52%
1 ene 1997 año
83.544
+3.168
3.94%
1 ene 1998 año
81.201
-2.343
-2.8%
1 ene 1999 año
74.591
-6.61
-8.14%
1 ene 2000 año
72.575
-2.015
-2.7%
1 ene 2001 año
72.02
-0.555
-0.77%
1 ene 2002 año
60.535
-11.485
-15.95%
1 ene 2003 año
65.708
+5.173
8.55%
1 ene 2004 año
73.792
+8.084
12.3%
1 ene 2005 año
67.341
-6.451
-8.74%
1 ene 2006 año
67.612
+0.271
0.4%
1 ene 2007 año
71.064
+3.452
5.11%
1 ene 2008 año
72.564
+1.5
2.11%
1 ene 2009 año
87.203
+14.638
20.17%
1 ene 2010 año
85.408
-1.795
-2.06%
1 ene 2011 año
86.669
+1.261
1.48%
1 ene 2012 año
84.008
-2.66
-3.07%
1 ene 2013 año
81.799
-2.209
-2.63%
1 ene 2014 año
68.024
-13.775
-16.84%
1 ene 2015 año
64.357
-3.667
-5.39%
1 ene 2016 año
75.664
+11.307
17.57%
Ranking de los países por los datos estadísticos actuales


Comentarios: