29
/es/
es
AIzaSyAYiBZKx7MnpbEhh9jyipgxe19OcubqV5w
April 1, 2024
275655
United Kingdom
GBR
true
2
1
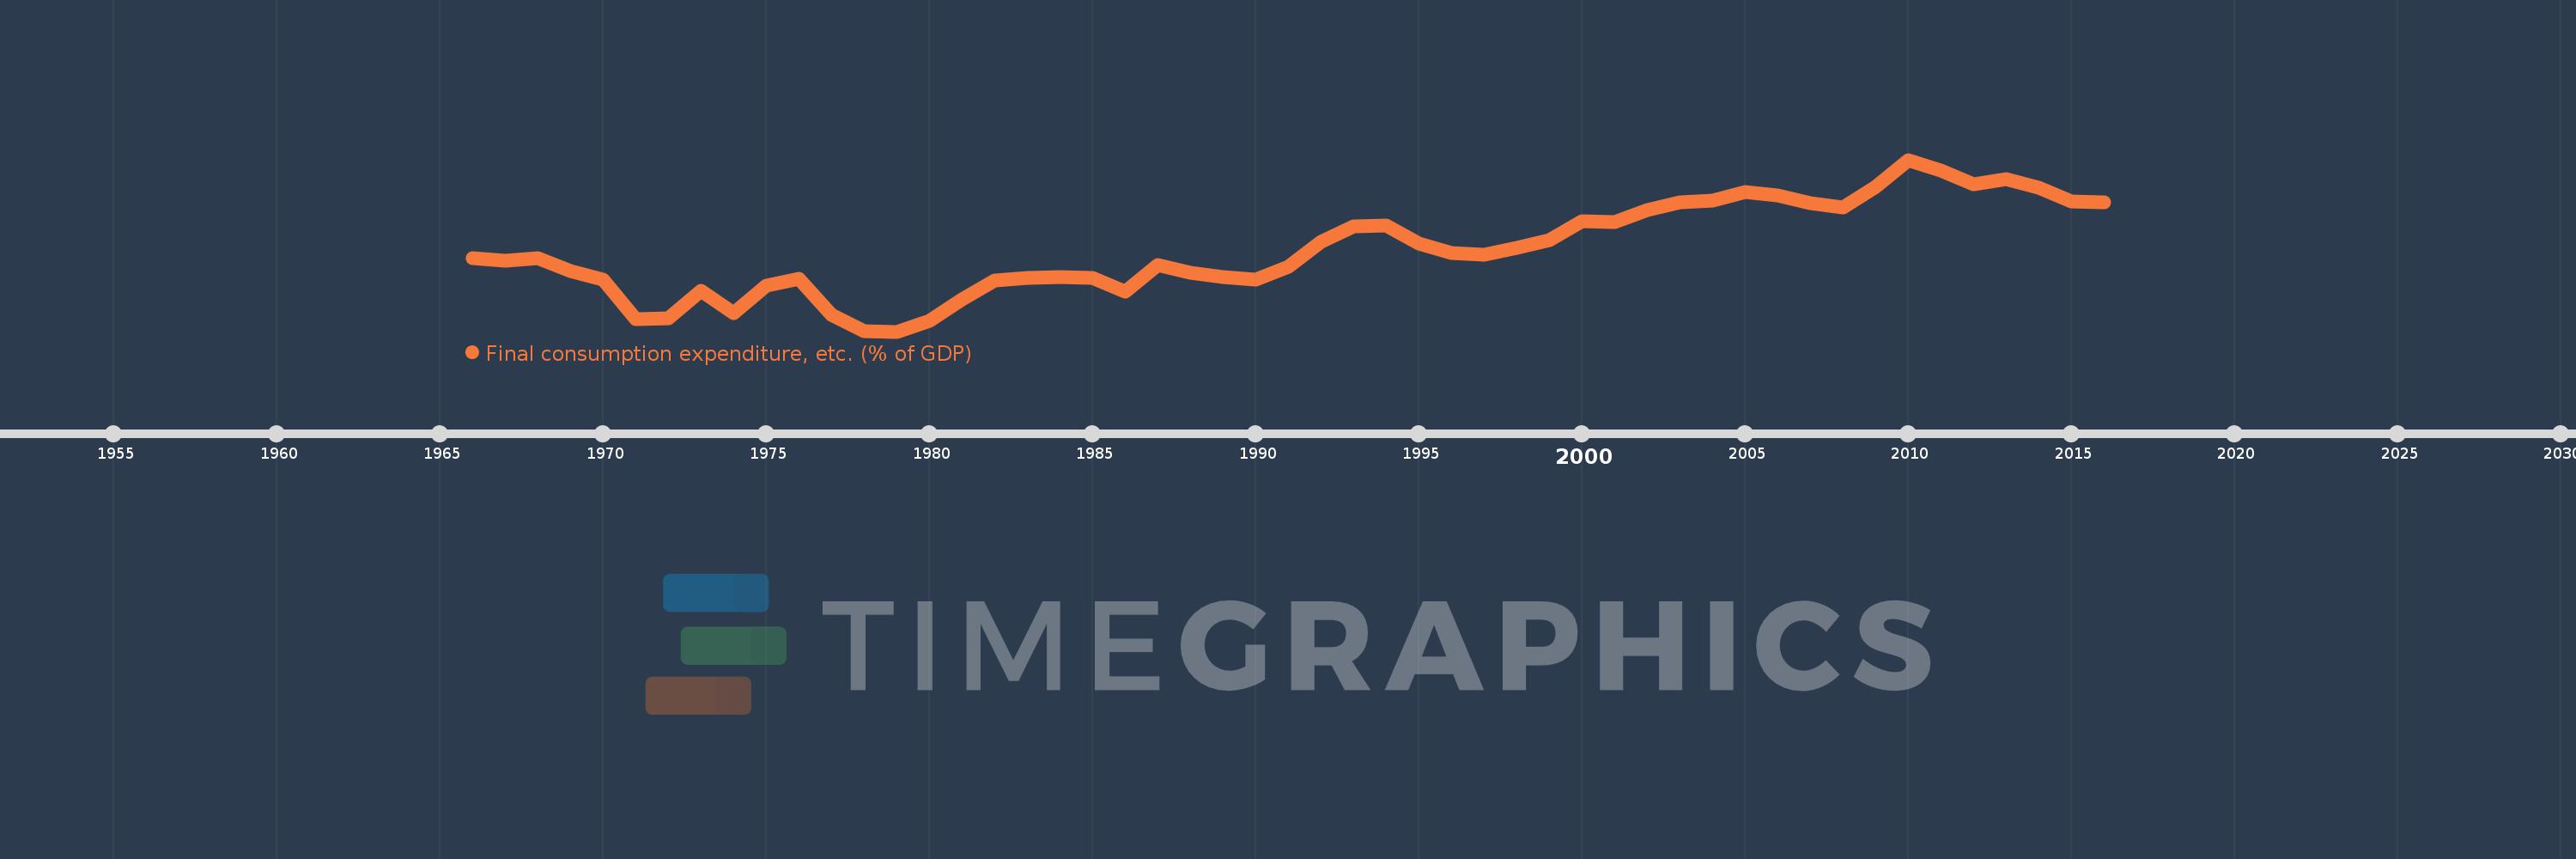
Final consumption expenditure, etc. (% of GDP)
2016,2015,2014,2013,2012,2011,2010,2009,2008,2007,2006,2005,2004,2003,2002,2001,2000,1999,1998,1997,1996,1995,1994,1993,1992,1991,1990,1989,1988,1987,1986,1985,1984,1983,1982,1981,1980,1979,1978,1977,1976,1975,1974,1973,1972,1971,1970,1969,1968,1967,1966
Estas estadísticas en otros países:
AfghanistanAlbaniaAlgeriaAngolaAntigua and BarbudaArgentinaArmeniaArubaAustraliaAustriaAzerbaijanBahamas, TheBahrainBangladeshBarbadosBelarusBelgiumBelizeBeninBermudaBhutanBoliviaBosnia and HerzegovinaBotswanaBrazilBrunei DarussalamBulgariaBurkina FasoBurundiCabo VerdeCambodiaCameroonCanadaCentral African RepublicChadChileChinaColombiaComorosCongo, Dem. Rep.Congo, Rep.Costa RicaCote d'IvoireCroatiaCubaCyprusCzech RepublicDenmarkDjiboutiDominicaDominican RepublicEcuadorEgypt, Arab Rep.El SalvadorEquatorial GuineaEritreaEstoniaEthiopiaFaroe IslandsFijiFinlandFranceGabonGambia, TheGeorgiaGermanyGhanaGreeceGrenadaGuatemalaGuineaGuinea-BissauGuyanaHaitiHondurasHong Kong SAR, ChinaHungaryIcelandIndiaIndonesiaIran, Islamic Rep.IraqIrelandIsraelItalyJamaicaJapanJordanKazakhstanKenyaKiribatiKorea, Rep.KosovoKuwaitKyrgyz RepublicLao PDRLatviaLebanonLesothoLiberiaLibyaLithuaniaLuxembourgMacao SAR, ChinaMacedonia, FYRMadagascarMalawiMalaysiaMaldivesMaliMaltaMauritaniaMauritiusMexicoMicronesia, Fed. Sts.MoldovaMongoliaMontenegroMoroccoMozambiqueNamibiaNepalNetherlandsNew CaledoniaNew ZealandNicaraguaNigerNigeriaNorwayOmanPakistanPanamaPapua New GuineaParaguayPeruPhilippinesPolandPortugalPuerto RicoQatarRomaniaRussian FederationRwandaSaudi ArabiaSenegalSerbiaSeychellesSierra LeoneSingaporeSlovak RepublicSloveniaSolomon IslandsSomaliaSouth AfricaSouth SudanSpainSri LankaSt. Kitts and NevisSt. LuciaSt. Vincent and the GrenadinesSudanSurinameSwazilandSwedenSwitzerlandSyrian Arab RepublicTajikistanTanzaniaThailandTimor-LesteTogoTongaTrinidad and TobagoTunisiaTurkeyTurkmenistanUgandaUkraineUnited Arab EmiratesUnited KingdomUnited StatesUruguayUzbekistanVanuatuVenezuela, RBVietnamWest Bank and GazaYemen, Rep.ZambiaZimbabwe línea de tiempo (timeline):
En esta escala de tiempo se presenta un gráfico de 1966 y 2016 de United Kingdom. Los datos de 1965 están ausentes. El número de observaciones reales por fecha: 51.
Fuente (nombre):
Indicadores del desarrollo mundial
Fuente (organización):
World Bank national accounts data, and OECD National Accounts data files.
Categorías:
Economy & Growth
Se ha actualizado:
23 abr 2017 año
Los indicadores de los cambios de valor en los últimos años
Mínimo:
75.289
1 ene 1979 año
Máximo:
87.527
1 ene 2010 año
A la fecha de observación
Valor
Cambio absoluto
El cambio con respecto al valor anterior
1 ene 1966 año
80.551
+80.551
0.0%
1 ene 1967 año
80.331
-0.22
-0.27%
1 ene 1968 año
80.55
+0.219
0.27%
1 ene 1969 año
79.586
-0.964
-1.2%
1 ene 1970 año
78.994
-0.593
-0.74%
1 ene 1971 año
76.17
-2.823
-3.57%
1 ene 1972 año
76.211
+0.041
0.05%
1 ene 1973 año
78.224
+2.013
2.64%
1 ene 1974 año
76.613
-1.611
-2.06%
1 ene 1975 año
78.541
+1.928
2.52%
1 ene 1976 año
79.067
+0.526
0.67%
1 ene 1977 año
76.494
-2.573
-3.25%
1 ene 1978 año
75.303
-1.191
-1.56%
1 ene 1979 año
75.289
-0.014
-0.02%
1 ene 1980 año
76.074
+0.785
1.04%
1 ene 1981 año
77.603
+1.528
2.01%
1 ene 1982 año
78.959
+1.356
1.75%
1 ene 1983 año
79.106
+0.147
0.19%
1 ene 1984 año
79.153
+0.047
0.06%
1 ene 1985 año
79.1
-0.054
-0.07%
1 ene 1986 año
78.136
-0.964
-1.22%
1 ene 1987 año
80.039
+1.903
2.43%
1 ene 1988 año
79.475
-0.563
-0.7%
1 ene 1989 año
79.195
-0.28
-0.35%
1 ene 1990 año
78.963
-0.232
-0.29%
1 ene 1991 año
79.938
+0.975
1.23%
1 ene 1992 año
81.709
+1.771
2.21%
1 ene 1993 año
82.762
+1.053
1.29%
1 ene 1994 año
82.848
+0.086
0.1%
1 ene 1995 año
81.563
-1.285
-1.55%
1 ene 1996 año
80.865
-0.697
-0.85%
1 ene 1997 año
80.765
-0.1
-0.12%
1 ene 1998 año
81.275
+0.51
0.63%
1 ene 1999 año
81.824
+0.549
0.68%
1 ene 2000 año
83.154
+1.329
1.62%
1 ene 2001 año
83.089
-0.065
-0.08%
1 ene 2002 año
83.948
+0.858
1.03%
1 ene 2003 año
84.522
+0.575
0.68%
1 ene 2004 año
84.601
+0.079
0.09%
1 ene 2005 año
85.22
+0.619
0.73%
1 ene 2006 año
84.989
-0.23
-0.27%
1 ene 2007 año
84.451
-0.538
-0.63%
1 ene 2008 año
84.109
-0.343
-0.41%
1 ene 2009 año
85.604
+1.496
1.78%
1 ene 2010 año
87.527
+1.923
2.25%
1 ene 2011 año
86.732
-0.795
-0.91%
1 ene 2012 año
85.803
-0.929
-1.07%
1 ene 2013 año
86.14
+0.337
0.39%
1 ene 2014 año
85.548
-0.592
-0.69%
1 ene 2015 año
84.579
-0.969
-1.13%
1 ene 2016 año
84.477
-0.102
-0.12%
Ranking de los países por los datos estadísticos actuales


Comentarios: