29
/es/
es
AIzaSyAYiBZKx7MnpbEhh9jyipgxe19OcubqV5w
April 1, 2024
97550
Cabo Verde
CPV
true
2
1
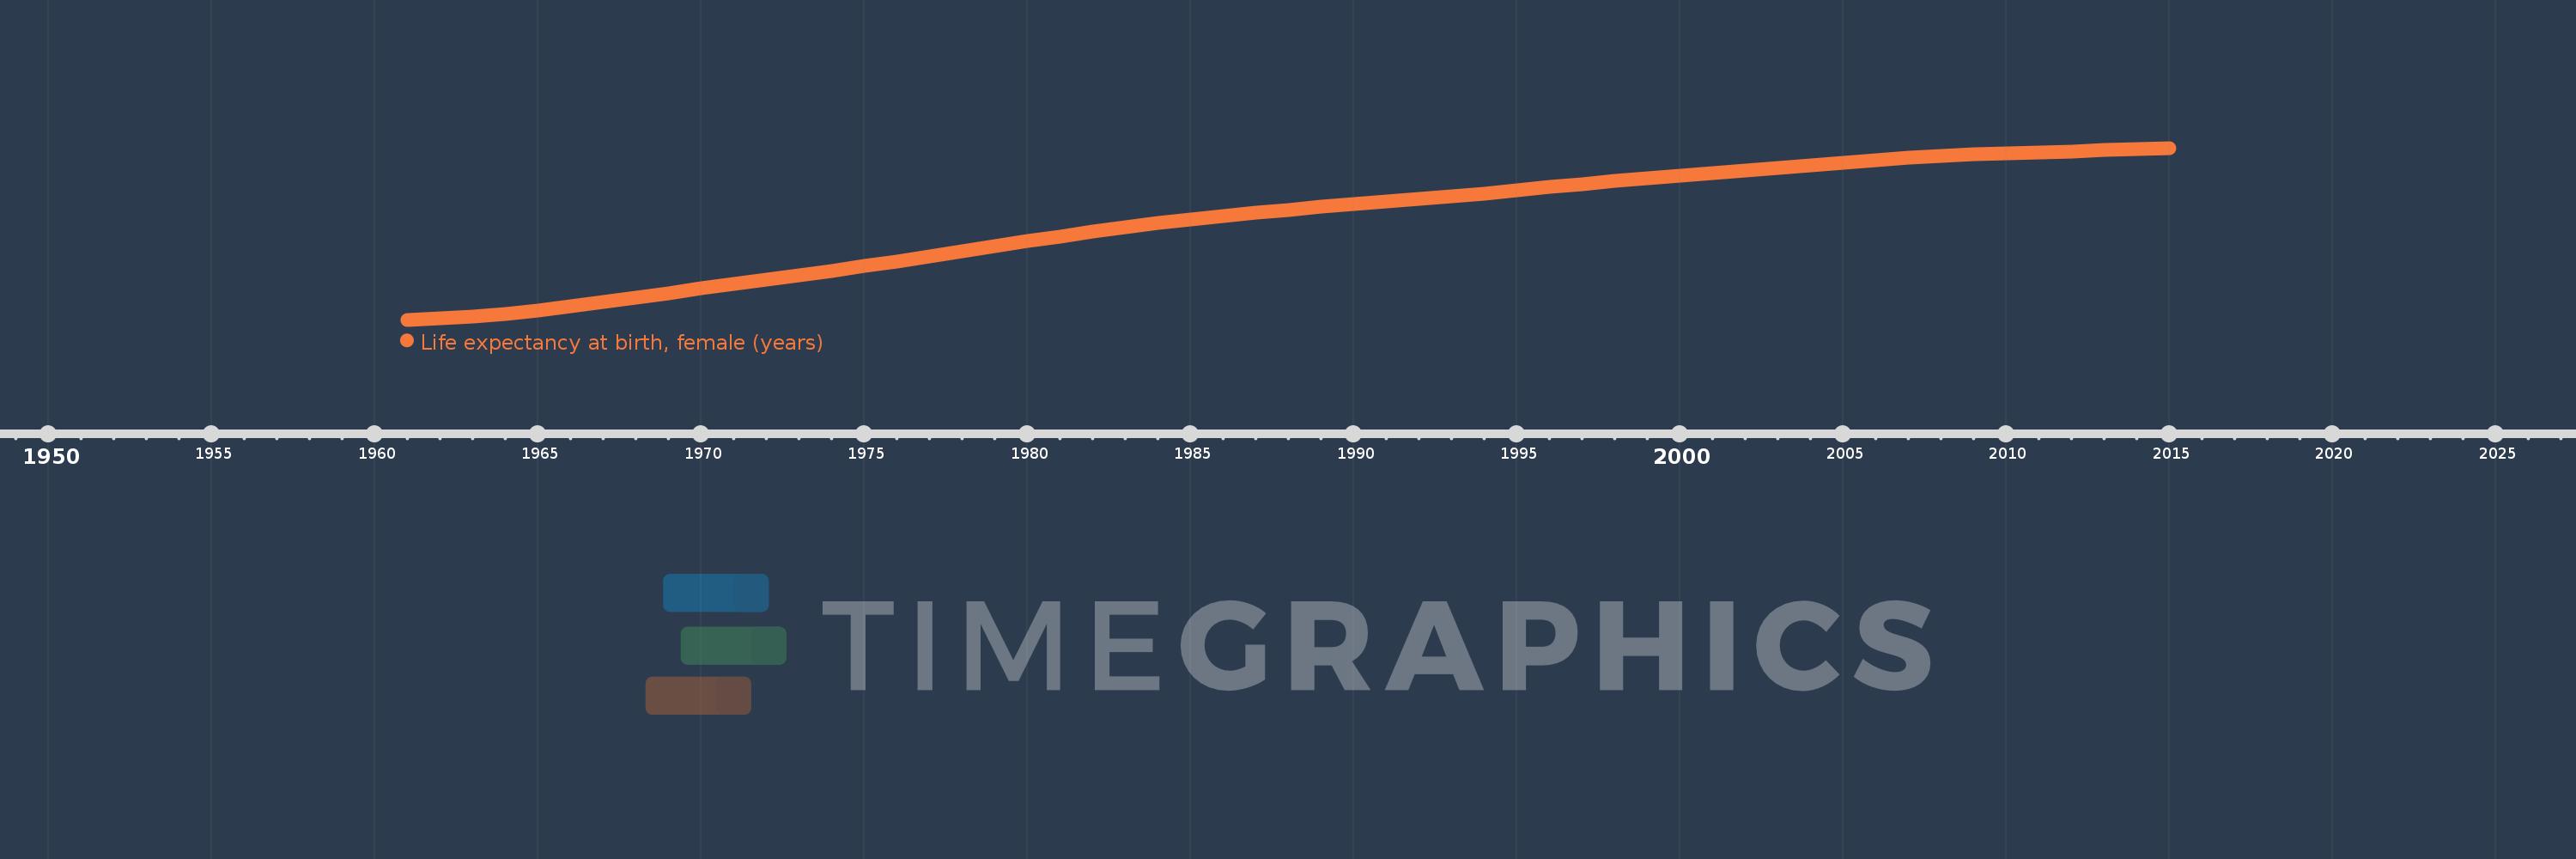
Life expectancy at birth, female (years)
2015,2014,2013,2012,2011,2010,2009,2008,2007,2006,2005,2004,2003,2002,2001,2000,1999,1998,1997,1996,1995,1994,1993,1992,1991,1990,1989,1988,1987,1986,1985,1984,1983,1982,1981,1980,1979,1978,1977,1976,1975,1974,1973,1972,1971,1970,1969,1968,1967,1966,1965,1964,1963,1962,1961
Estas estadísticas en otros países:
AfghanistanAlbaniaAlgeriaAngolaAntigua and BarbudaArab WorldArgentinaArmeniaArubaAustraliaAustriaAzerbaijanBahamas, TheBahrainBangladeshBarbadosBelarusBelgiumBelizeBeninBermudaBhutanBoliviaBosnia and HerzegovinaBotswanaBrazilBrunei DarussalamBulgariaBurkina FasoBurundiCabo VerdeCambodiaCameroonCanadaCaribbean small statesCentral African RepublicCentral Europe and the BalticsChadChannel IslandsChileChinaColombiaComorosCongo, Dem. Rep.Congo, Rep.Costa RicaCote d'IvoireCroatiaCubaCuracaoCyprusCzech RepublicDenmarkDjiboutiDominicaDominican RepublicEarly-demographic dividendEast Asia & PacificEast Asia & Pacific (excluding high income)East Asia & Pacific (IDA & IBRD countries)EcuadorEgypt, Arab Rep.El SalvadorEquatorial GuineaEritreaEstoniaEthiopiaEuro areaEurope & Central AsiaEurope & Central Asia (excluding high income)Europe & Central Asia (IDA & IBRD countries)European UnionFaroe IslandsFijiFinlandFragile and conflict affected situationsFranceFrench PolynesiaGabonGambia, TheGeorgiaGermanyGhanaGreeceGreenlandGrenadaGuamGuatemalaGuineaGuinea-BissauGuyanaHaitiHeavily indebted poor countries (HIPC)High incomeHondurasHong Kong SAR, ChinaHungaryIBRD onlyIcelandIDA & IBRD totalIDA blendIDA onlyIDA totalIndiaIndonesiaIran, Islamic Rep.IraqIrelandIsle of ManIsraelItalyJamaicaJapanJordanKazakhstanKenyaKiribatiKorea, Dem. People’s Rep.Korea, Rep.KosovoKuwaitKyrgyz RepublicLao PDRLate-demographic dividendLatin America & Caribbean Latin America & Caribbean (excluding high income)Latin America & the Caribbean (IDA & IBRD countries)LatviaLeast developed countries: UN classificationLebanonLesothoLiberiaLibyaLiechtensteinLithuaniaLow & middle incomeLow incomeLower middle incomeLuxembourgMacao SAR, ChinaMacedonia, FYRMadagascarMalawiMalaysiaMaldivesMaliMaltaMarshall IslandsMauritaniaMauritiusMexicoMicronesia, Fed. Sts.Middle East & North AfricaMiddle East & North Africa (excluding high income)Middle East & North Africa (IDA & IBRD countries)Middle incomeMoldovaMongoliaMontenegroMoroccoMozambiqueMyanmarNamibiaNepalNetherlandsNew CaledoniaNew ZealandNicaraguaNigerNigeriaNorth AmericaNorwayOECD membersOmanOther small statesPacific island small statesPakistanPalauPanamaPapua New GuineaParaguayPeruPhilippinesPolandPortugalPost-demographic dividendPre-demographic dividendPuerto RicoQatarRomaniaRussian FederationRwandaSamoaSan MarinoSao Tome and PrincipeSaudi ArabiaSenegalSerbiaSeychellesSierra LeoneSingaporeSint Maarten (Dutch part)Slovak RepublicSloveniaSmall statesSolomon IslandsSomaliaSouth AfricaSouth AsiaSouth Asia (IDA & IBRD)South SudanSpainSri LankaSt. Kitts and NevisSt. LuciaSt. Martin (French part)St. Vincent and the GrenadinesSub-Saharan Africa Sub-Saharan Africa (excluding high income)Sub-Saharan Africa (IDA & IBRD countries)SudanSurinameSwazilandSwedenSwitzerlandSyrian Arab RepublicTajikistanTanzaniaThailandTimor-LesteTogoTongaTrinidad and TobagoTunisiaTurkeyTurkmenistanUgandaUkraineUnited Arab EmiratesUnited KingdomUnited StatesUpper middle incomeUruguayUzbekistanVanuatuVenezuela, RBVietnamVirgin Islands (U.S.)West Bank and GazaWorldYemen, Rep.ZambiaZimbabwe línea de tiempo (timeline):
En esta escala de tiempo se presenta un gráfico de 1961 y 2015 de Cabo Verde. Los datos de 1960 están ausentes. El número de observaciones reales por fecha: 55.
Fuente (nombre):
Indicadores del desarrollo mundial
Fuente (organización):
(1) United Nations Population Division. World Population Prospects, (2) Census reports and other statistical publications from national statistical offices, (3) Eurostat: Demographic Statistics, (4) United Nations Statistical Division. Population and Vital Statistics Reprot (various years), (5) U.S. Census Bureau: International Database, and (6) Secretariat of the Pacific Community: Statistics and Demography Programme.
Categorías:
Health, Gender, Social Development
Se ha actualizado:
23 abr 2017 año
Los indicadores de los cambios de valor en los últimos años
Mínimo:
50.078
1 ene 1961 año
Máximo:
75.016
1 ene 2015 año
A la fecha de observación
Valor
Cambio absoluto
El cambio con respecto al valor anterior
1 ene 1961 año
50.078
+50.078
0.0%
1 ene 1962 año
50.286
+0.208
0.42%
1 ene 1963 año
50.576
+0.29
0.58%
1 ene 1964 año
50.961
+0.385
0.76%
1 ene 1965 año
51.441
+0.48
0.94%
1 ene 1966 año
52.004
+0.563
1.09%
1 ene 1967 año
52.628
+0.624
1.2%
1 ene 1968 año
53.283
+0.655
1.24%
1 ene 1969 año
53.944
+0.661
1.24%
1 ene 1970 año
54.597
+0.653
1.21%
1 ene 1971 año
55.24
+0.643
1.18%
1 ene 1972 año
55.877
+0.637
1.15%
1 ene 1973 año
56.522
+0.645
1.15%
1 ene 1974 año
57.183
+0.661
1.17%
1 ene 1975 año
57.861
+0.678
1.19%
1 ene 1976 año
58.557
+0.696
1.2%
1 ene 1977 año
59.273
+0.716
1.22%
1 ene 1978 año
60.003
+0.73
1.23%
1 ene 1979 año
60.738
+0.735
1.22%
1 ene 1980 año
61.469
+0.731
1.2%
1 ene 1981 año
62.182
+0.713
1.16%
1 ene 1982 año
62.864
+0.682
1.1%
1 ene 1983 año
63.507
+0.643
1.02%
1 ene 1984 año
64.106
+0.599
0.94%
1 ene 1985 año
64.657
+0.551
0.86%
1 ene 1986 año
65.16
+0.503
0.78%
1 ene 1987 año
65.617
+0.457
0.7%
1 ene 1988 año
66.039
+0.422
0.64%
1 ene 1989 año
66.438
+0.399
0.6%
1 ene 1990 año
66.824
+0.386
0.58%
1 ene 1991 año
67.208
+0.384
0.57%
1 ene 1992 año
67.601
+0.393
0.58%
1 ene 1993 año
68.008
+0.407
0.6%
1 ene 1994 año
68.429
+0.421
0.62%
1 ene 1995 año
68.865
+0.436
0.64%
1 ene 1996 año
69.31
+0.445
0.65%
1 ene 1997 año
69.755
+0.445
0.64%
1 ene 1998 año
70.191
+0.436
0.63%
1 ene 1999 año
70.608
+0.417
0.59%
1 ene 2000 año
71.006
+0.398
0.56%
1 ene 2001 año
71.388
+0.382
0.54%
1 ene 2002 año
71.765
+0.377
0.53%
1 ene 2003 año
72.143
+0.378
0.53%
1 ene 2004 año
72.524
+0.381
0.53%
1 ene 2005 año
72.903
+0.379
0.52%
1 ene 2006 año
73.265
+0.362
0.5%
1 ene 2007 año
73.592
+0.327
0.45%
1 ene 2008 año
73.869
+0.277
0.38%
1 ene 2009 año
74.093
+0.224
0.3%
1 ene 2010 año
74.268
+0.175
0.24%
1 ene 2011 año
74.408
+0.14
0.19%
1 ene 2012 año
74.534
+0.126
0.17%
1 ene 2013 año
74.667
+0.133
0.18%
1 ene 2014 año
74.826
+0.159
0.21%
1 ene 2015 año
75.016
+0.19
0.25%
Ranking de los países por los datos estadísticos actuales


Comentarios: