29
/es/
es
AIzaSyAYiBZKx7MnpbEhh9jyipgxe19OcubqV5w
April 1, 2024
277893
Uruguay
URY
true
2
1
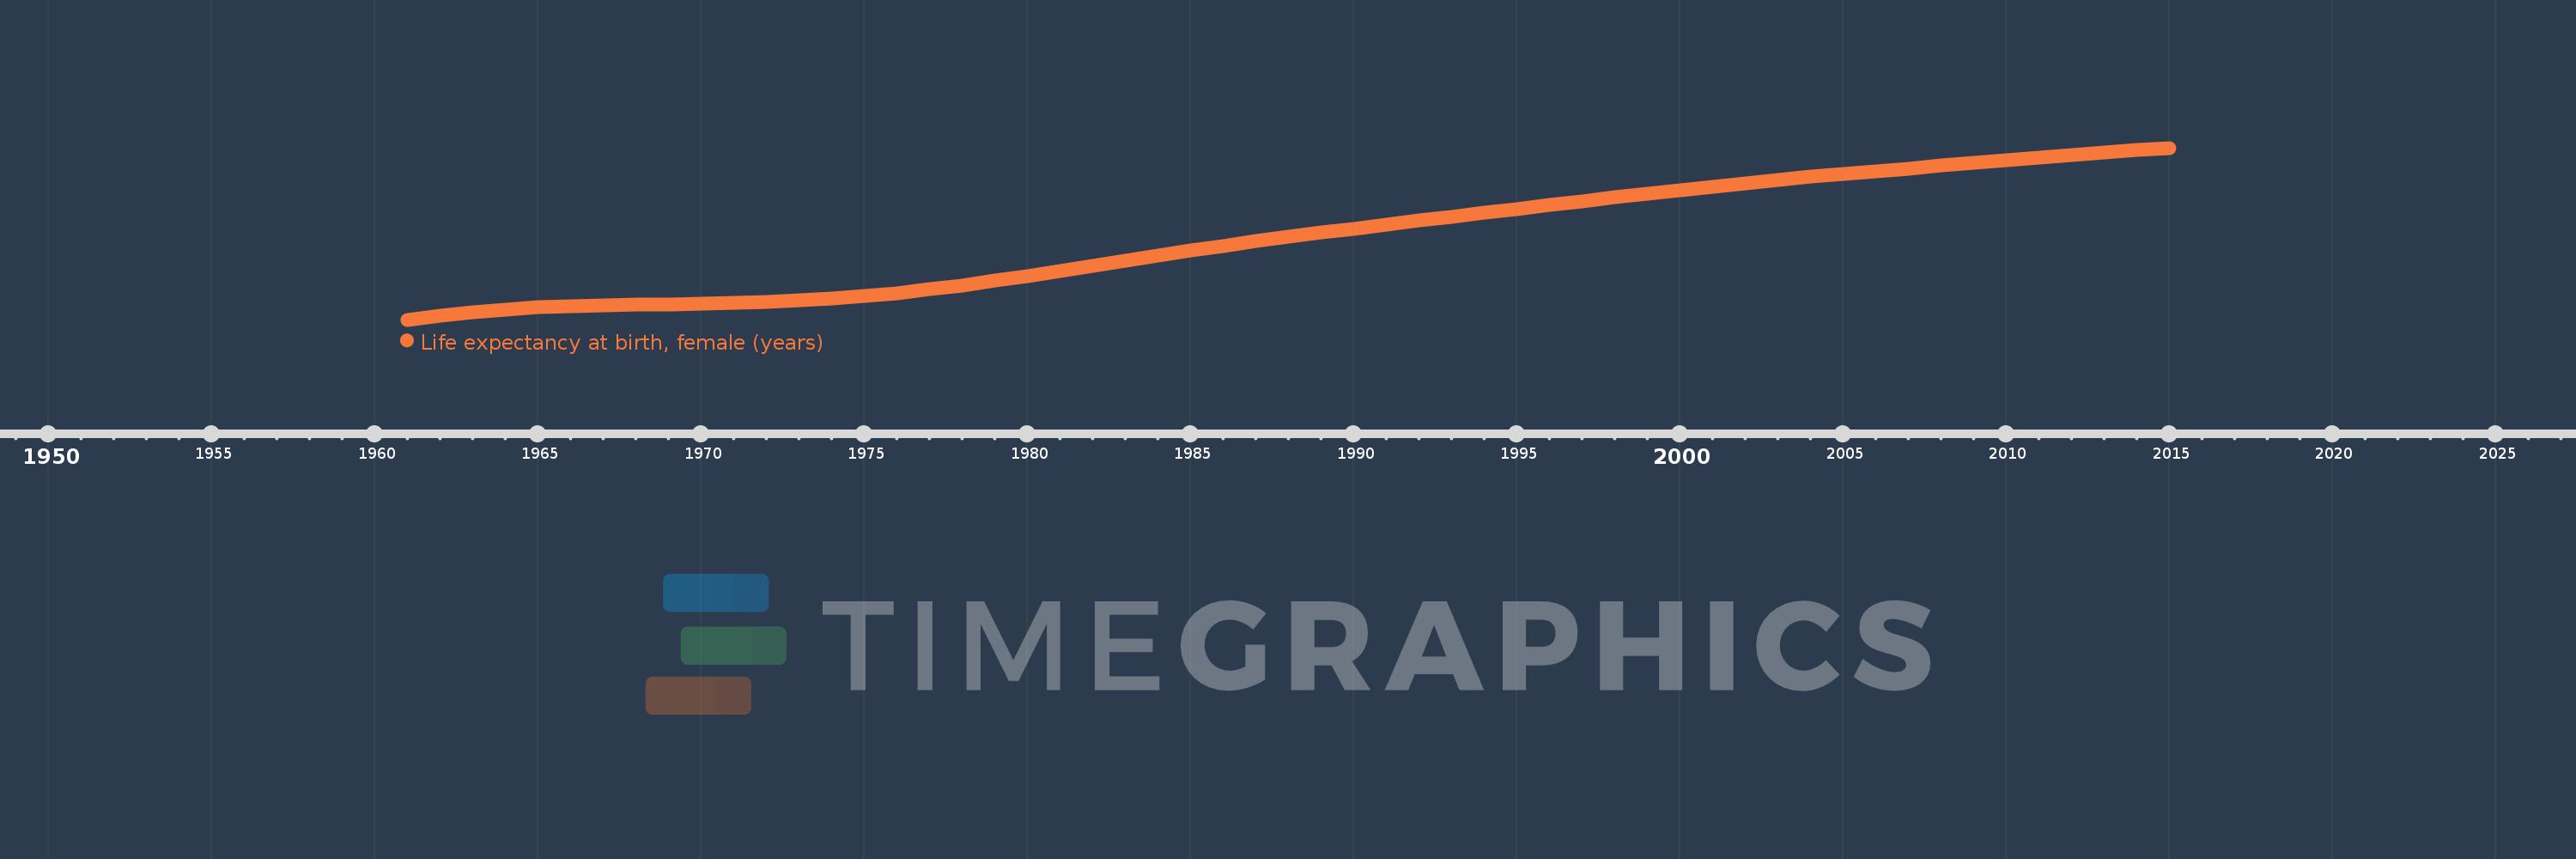
Life expectancy at birth, female (years)
2015,2014,2013,2012,2011,2010,2009,2008,2007,2006,2005,2004,2003,2002,2001,2000,1999,1998,1997,1996,1995,1994,1993,1992,1991,1990,1989,1988,1987,1986,1985,1984,1983,1982,1981,1980,1979,1978,1977,1976,1975,1974,1973,1972,1971,1970,1969,1968,1967,1966,1965,1964,1963,1962,1961
Estas estadísticas en otros países:
AfghanistanAlbaniaAlgeriaAngolaAntigua and BarbudaArab WorldArgentinaArmeniaArubaAustraliaAustriaAzerbaijanBahamas, TheBahrainBangladeshBarbadosBelarusBelgiumBelizeBeninBermudaBhutanBoliviaBosnia and HerzegovinaBotswanaBrazilBrunei DarussalamBulgariaBurkina FasoBurundiCabo VerdeCambodiaCameroonCanadaCaribbean small statesCentral African RepublicCentral Europe and the BalticsChadChannel IslandsChileChinaColombiaComorosCongo, Dem. Rep.Congo, Rep.Costa RicaCote d'IvoireCroatiaCubaCuracaoCyprusCzech RepublicDenmarkDjiboutiDominicaDominican RepublicEarly-demographic dividendEast Asia & PacificEast Asia & Pacific (excluding high income)East Asia & Pacific (IDA & IBRD countries)EcuadorEgypt, Arab Rep.El SalvadorEquatorial GuineaEritreaEstoniaEthiopiaEuro areaEurope & Central AsiaEurope & Central Asia (excluding high income)Europe & Central Asia (IDA & IBRD countries)European UnionFaroe IslandsFijiFinlandFragile and conflict affected situationsFranceFrench PolynesiaGabonGambia, TheGeorgiaGermanyGhanaGreeceGreenlandGrenadaGuamGuatemalaGuineaGuinea-BissauGuyanaHaitiHeavily indebted poor countries (HIPC)High incomeHondurasHong Kong SAR, ChinaHungaryIBRD onlyIcelandIDA & IBRD totalIDA blendIDA onlyIDA totalIndiaIndonesiaIran, Islamic Rep.IraqIrelandIsle of ManIsraelItalyJamaicaJapanJordanKazakhstanKenyaKiribatiKorea, Dem. People’s Rep.Korea, Rep.KosovoKuwaitKyrgyz RepublicLao PDRLate-demographic dividendLatin America & Caribbean Latin America & Caribbean (excluding high income)Latin America & the Caribbean (IDA & IBRD countries)LatviaLeast developed countries: UN classificationLebanonLesothoLiberiaLibyaLiechtensteinLithuaniaLow & middle incomeLow incomeLower middle incomeLuxembourgMacao SAR, ChinaMacedonia, FYRMadagascarMalawiMalaysiaMaldivesMaliMaltaMarshall IslandsMauritaniaMauritiusMexicoMicronesia, Fed. Sts.Middle East & North AfricaMiddle East & North Africa (excluding high income)Middle East & North Africa (IDA & IBRD countries)Middle incomeMoldovaMongoliaMontenegroMoroccoMozambiqueMyanmarNamibiaNepalNetherlandsNew CaledoniaNew ZealandNicaraguaNigerNigeriaNorth AmericaNorwayOECD membersOmanOther small statesPacific island small statesPakistanPalauPanamaPapua New GuineaParaguayPeruPhilippinesPolandPortugalPost-demographic dividendPre-demographic dividendPuerto RicoQatarRomaniaRussian FederationRwandaSamoaSan MarinoSao Tome and PrincipeSaudi ArabiaSenegalSerbiaSeychellesSierra LeoneSingaporeSint Maarten (Dutch part)Slovak RepublicSloveniaSmall statesSolomon IslandsSomaliaSouth AfricaSouth AsiaSouth Asia (IDA & IBRD)South SudanSpainSri LankaSt. Kitts and NevisSt. LuciaSt. Martin (French part)St. Vincent and the GrenadinesSub-Saharan Africa Sub-Saharan Africa (excluding high income)Sub-Saharan Africa (IDA & IBRD countries)SudanSurinameSwazilandSwedenSwitzerlandSyrian Arab RepublicTajikistanTanzaniaThailandTimor-LesteTogoTongaTrinidad and TobagoTunisiaTurkeyTurkmenistanUgandaUkraineUnited Arab EmiratesUnited KingdomUnited StatesUpper middle incomeUruguayUzbekistanVanuatuVenezuela, RBVietnamVirgin Islands (U.S.)West Bank and GazaWorldYemen, Rep.ZambiaZimbabwe línea de tiempo (timeline):
En esta escala de tiempo se presenta un gráfico de 1961 y 2015 de Uruguay. Los datos de 1960 están ausentes. El número de observaciones reales por fecha: 55.
Fuente (nombre):
Indicadores del desarrollo mundial
Fuente (organización):
(1) United Nations Population Division. World Population Prospects, (2) Census reports and other statistical publications from national statistical offices, (3) Eurostat: Demographic Statistics, (4) United Nations Statistical Division. Population and Vital Statistics Reprot (various years), (5) U.S. Census Bureau: International Database, and (6) Secretariat of the Pacific Community: Statistics and Demography Programme.
Categorías:
Health, Gender, Social Development
Se ha actualizado:
23 abr 2017 año
Los indicadores de los cambios de valor en los últimos años
Mínimo:
71.093
1 ene 1961 año
Máximo:
80.634
1 ene 2015 año
A la fecha de observación
Valor
Cambio absoluto
El cambio con respecto al valor anterior
1 ene 1961 año
71.093
+71.093
0.0%
1 ene 1962 año
71.314
+0.221
0.31%
1 ene 1963 año
71.504
+0.19
0.27%
1 ene 1964 año
71.657
+0.153
0.21%
1 ene 1965 año
71.771
+0.114
0.16%
1 ene 1966 año
71.849
+0.078
0.11%
1 ene 1967 año
71.894
+0.045
0.06%
1 ene 1968 año
71.921
+0.027
0.04%
1 ene 1969 año
71.944
+0.023
0.03%
1 ene 1970 año
71.971
+0.027
0.04%
1 ene 1971 año
72.012
+0.041
0.06%
1 ene 1972 año
72.075
+0.063
0.09%
1 ene 1973 año
72.16
+0.085
0.12%
1 ene 1974 año
72.269
+0.109
0.15%
1 ene 1975 año
72.405
+0.136
0.19%
1 ene 1976 año
72.573
+0.168
0.23%
1 ene 1977 año
72.773
+0.2
0.28%
1 ene 1978 año
73.001
+0.228
0.31%
1 ene 1979 año
73.252
+0.251
0.34%
1 ene 1980 año
73.521
+0.269
0.37%
1 ene 1981 año
73.802
+0.281
0.38%
1 ene 1982 año
74.088
+0.286
0.39%
1 ene 1983 año
74.376
+0.288
0.39%
1 ene 1984 año
74.659
+0.283
0.38%
1 ene 1985 año
74.934
+0.275
0.37%
1 ene 1986 año
75.197
+0.263
0.35%
1 ene 1987 año
75.449
+0.252
0.34%
1 ene 1988 año
75.691
+0.242
0.32%
1 ene 1989 año
75.927
+0.236
0.31%
1 ene 1990 año
76.157
+0.23
0.3%
1 ene 1991 año
76.381
+0.224
0.29%
1 ene 1992 año
76.602
+0.221
0.29%
1 ene 1993 año
76.821
+0.219
0.29%
1 ene 1994 año
77.038
+0.217
0.28%
1 ene 1995 año
77.254
+0.216
0.28%
1 ene 1996 año
77.468
+0.214
0.28%
1 ene 1997 año
77.681
+0.213
0.27%
1 ene 1998 año
77.89
+0.209
0.27%
1 ene 1999 año
78.095
+0.205
0.26%
1 ene 2000 año
78.295
+0.2
0.26%
1 ene 2001 año
78.488
+0.193
0.25%
1 ene 2002 año
78.674
+0.186
0.24%
1 ene 2003 año
78.852
+0.178
0.23%
1 ene 2004 año
79.022
+0.17
0.22%
1 ene 2005 año
79.185
+0.163
0.21%
1 ene 2006 año
79.343
+0.158
0.2%
1 ene 2007 año
79.496
+0.153
0.19%
1 ene 2008 año
79.646
+0.15
0.19%
1 ene 2009 año
79.794
+0.148
0.19%
1 ene 2010 año
79.941
+0.147
0.18%
1 ene 2011 año
80.086
+0.145
0.18%
1 ene 2012 año
80.229
+0.143
0.18%
1 ene 2013 año
80.368
+0.139
0.17%
1 ene 2014 año
80.503
+0.135
0.17%
1 ene 2015 año
80.634
+0.131
0.16%
Ranking de los países por los datos estadísticos actuales


Comentarios: