29
/es/
es
AIzaSyAYiBZKx7MnpbEhh9jyipgxe19OcubqV5w
April 1, 2024
67957
Angola
AGO
true
2
1
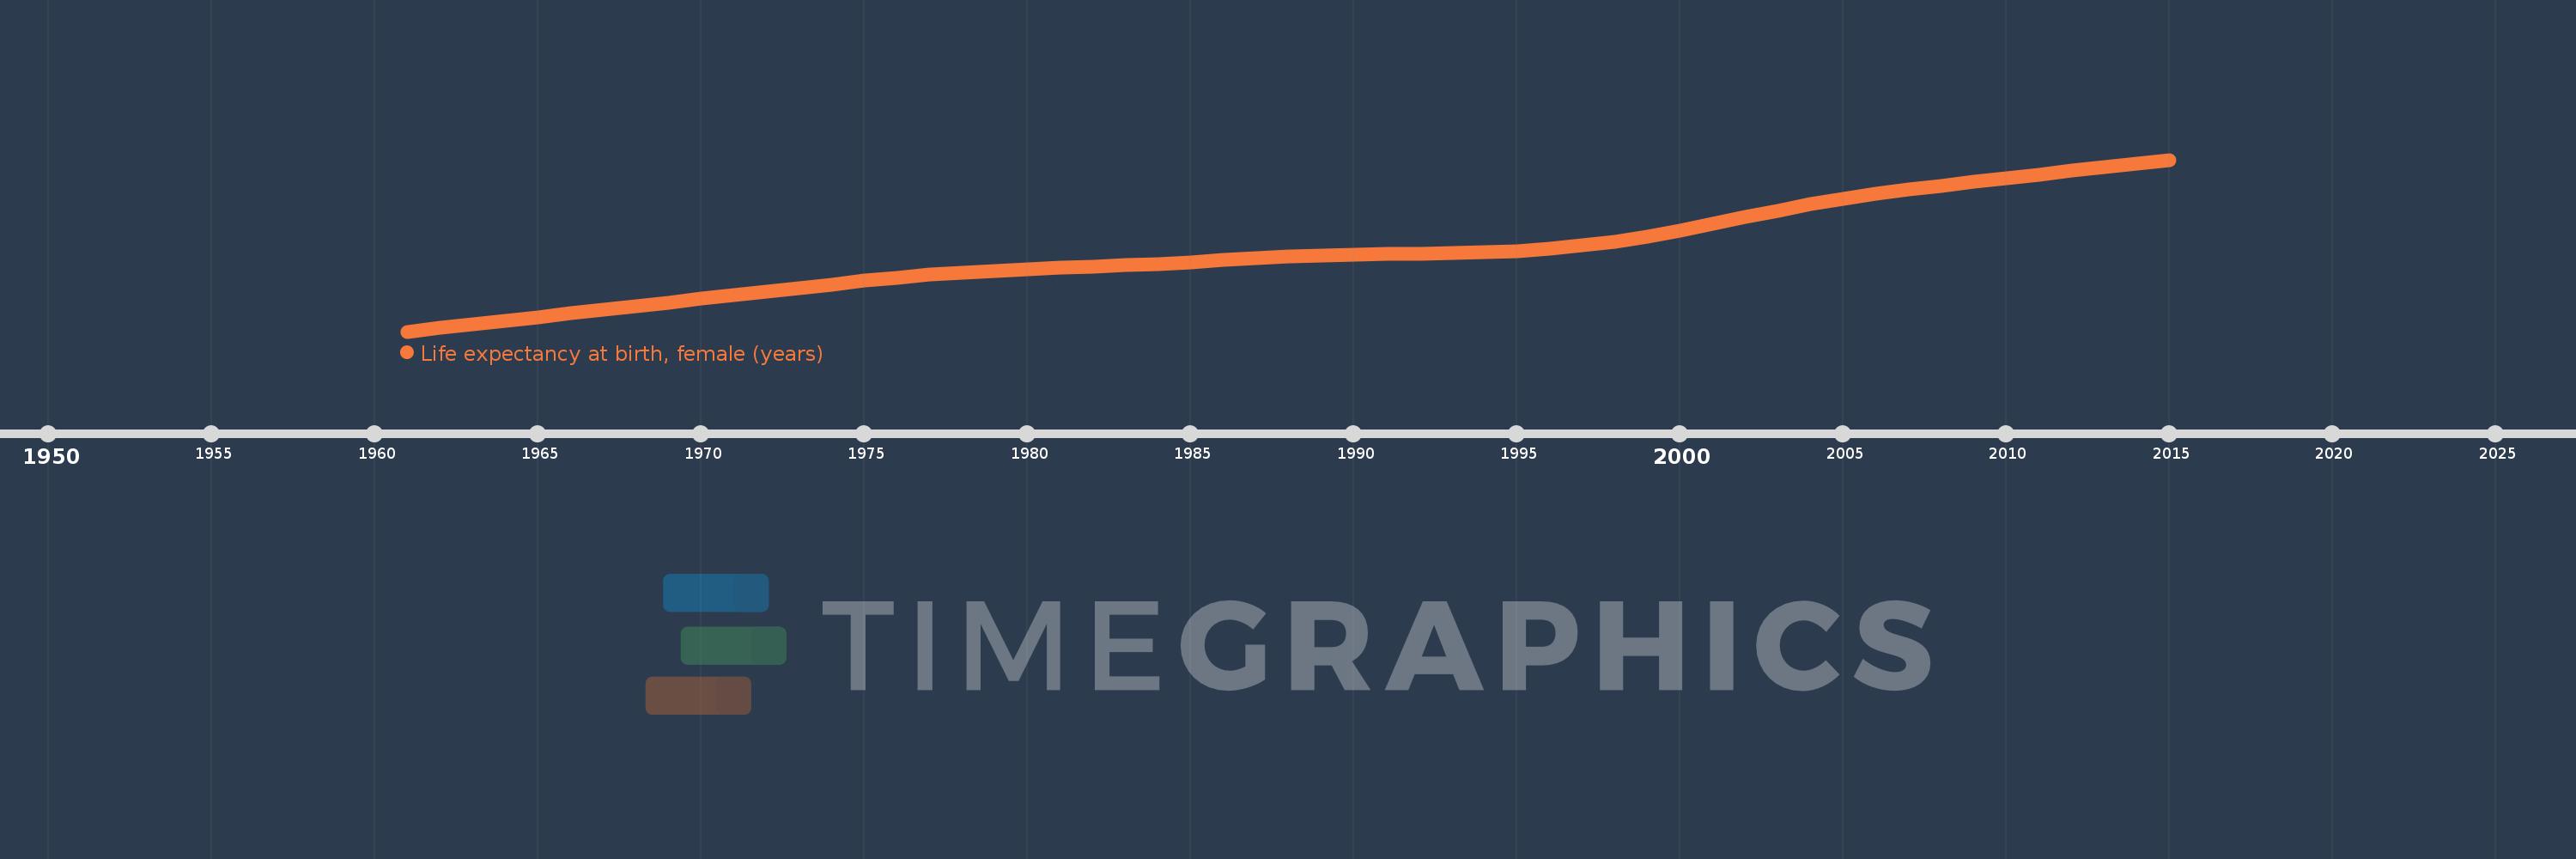
Life expectancy at birth, female (years)
2015,2014,2013,2012,2011,2010,2009,2008,2007,2006,2005,2004,2003,2002,2001,2000,1999,1998,1997,1996,1995,1994,1993,1992,1991,1990,1989,1988,1987,1986,1985,1984,1983,1982,1981,1980,1979,1978,1977,1976,1975,1974,1973,1972,1971,1970,1969,1968,1967,1966,1965,1964,1963,1962,1961
Estas estadísticas en otros países:
AfghanistanAlbaniaAlgeriaAngolaAntigua and BarbudaArab WorldArgentinaArmeniaArubaAustraliaAustriaAzerbaijanBahamas, TheBahrainBangladeshBarbadosBelarusBelgiumBelizeBeninBermudaBhutanBoliviaBosnia and HerzegovinaBotswanaBrazilBrunei DarussalamBulgariaBurkina FasoBurundiCabo VerdeCambodiaCameroonCanadaCaribbean small statesCentral African RepublicCentral Europe and the BalticsChadChannel IslandsChileChinaColombiaComorosCongo, Dem. Rep.Congo, Rep.Costa RicaCote d'IvoireCroatiaCubaCuracaoCyprusCzech RepublicDenmarkDjiboutiDominicaDominican RepublicEarly-demographic dividendEast Asia & PacificEast Asia & Pacific (excluding high income)East Asia & Pacific (IDA & IBRD countries)EcuadorEgypt, Arab Rep.El SalvadorEquatorial GuineaEritreaEstoniaEthiopiaEuro areaEurope & Central AsiaEurope & Central Asia (excluding high income)Europe & Central Asia (IDA & IBRD countries)European UnionFaroe IslandsFijiFinlandFragile and conflict affected situationsFranceFrench PolynesiaGabonGambia, TheGeorgiaGermanyGhanaGreeceGreenlandGrenadaGuamGuatemalaGuineaGuinea-BissauGuyanaHaitiHeavily indebted poor countries (HIPC)High incomeHondurasHong Kong SAR, ChinaHungaryIBRD onlyIcelandIDA & IBRD totalIDA blendIDA onlyIDA totalIndiaIndonesiaIran, Islamic Rep.IraqIrelandIsle of ManIsraelItalyJamaicaJapanJordanKazakhstanKenyaKiribatiKorea, Dem. People’s Rep.Korea, Rep.KosovoKuwaitKyrgyz RepublicLao PDRLate-demographic dividendLatin America & Caribbean Latin America & Caribbean (excluding high income)Latin America & the Caribbean (IDA & IBRD countries)LatviaLeast developed countries: UN classificationLebanonLesothoLiberiaLibyaLiechtensteinLithuaniaLow & middle incomeLow incomeLower middle incomeLuxembourgMacao SAR, ChinaMacedonia, FYRMadagascarMalawiMalaysiaMaldivesMaliMaltaMarshall IslandsMauritaniaMauritiusMexicoMicronesia, Fed. Sts.Middle East & North AfricaMiddle East & North Africa (excluding high income)Middle East & North Africa (IDA & IBRD countries)Middle incomeMoldovaMongoliaMontenegroMoroccoMozambiqueMyanmarNamibiaNepalNetherlandsNew CaledoniaNew ZealandNicaraguaNigerNigeriaNorth AmericaNorwayOECD membersOmanOther small statesPacific island small statesPakistanPalauPanamaPapua New GuineaParaguayPeruPhilippinesPolandPortugalPost-demographic dividendPre-demographic dividendPuerto RicoQatarRomaniaRussian FederationRwandaSamoaSan MarinoSao Tome and PrincipeSaudi ArabiaSenegalSerbiaSeychellesSierra LeoneSingaporeSint Maarten (Dutch part)Slovak RepublicSloveniaSmall statesSolomon IslandsSomaliaSouth AfricaSouth AsiaSouth Asia (IDA & IBRD)South SudanSpainSri LankaSt. Kitts and NevisSt. LuciaSt. Martin (French part)St. Vincent and the GrenadinesSub-Saharan Africa Sub-Saharan Africa (excluding high income)Sub-Saharan Africa (IDA & IBRD countries)SudanSurinameSwazilandSwedenSwitzerlandSyrian Arab RepublicTajikistanTanzaniaThailandTimor-LesteTogoTongaTrinidad and TobagoTunisiaTurkeyTurkmenistanUgandaUkraineUnited Arab EmiratesUnited KingdomUnited StatesUpper middle incomeUruguayUzbekistanVanuatuVenezuela, RBVietnamVirgin Islands (U.S.)West Bank and GazaWorldYemen, Rep.ZambiaZimbabwe línea de tiempo (timeline):
En esta escala de tiempo se presenta un gráfico de 1961 y 2015 de Angola. Los datos de 1960 están ausentes. El número de observaciones reales por fecha: 55.
Fuente (nombre):
Indicadores del desarrollo mundial
Fuente (organización):
(1) United Nations Population Division. World Population Prospects, (2) Census reports and other statistical publications from national statistical offices, (3) Eurostat: Demographic Statistics, (4) United Nations Statistical Division. Population and Vital Statistics Reprot (various years), (5) U.S. Census Bureau: International Database, and (6) Secretariat of the Pacific Community: Statistics and Demography Programme.
Categorías:
Health, Gender, Social Development
Se ha actualizado:
23 abr 2017 año
Los indicadores de los cambios de valor en los últimos años
Mínimo:
34.504
1 ene 1961 año
Máximo:
53.805
1 ene 2015 año
A la fecha de observación
Valor
Cambio absoluto
El cambio con respecto al valor anterior
1 ene 1961 año
34.504
+34.504
0.0%
1 ene 1962 año
34.91
+0.406
1.18%
1 ene 1963 año
35.317
+0.407
1.17%
1 ene 1964 año
35.723
+0.406
1.15%
1 ene 1965 año
36.13
+0.407
1.14%
1 ene 1966 año
36.537
+0.407
1.13%
1 ene 1967 año
36.945
+0.408
1.12%
1 ene 1968 año
37.355
+0.41
1.11%
1 ene 1969 año
37.766
+0.411
1.1%
1 ene 1970 año
38.175
+0.409
1.08%
1 ene 1971 año
38.585
+0.41
1.07%
1 ene 1972 año
38.995
+0.41
1.06%
1 ene 1973 año
39.405
+0.41
1.05%
1 ene 1974 año
39.809
+0.404
1.03%
1 ene 1975 año
40.198
+0.389
0.98%
1 ene 1976 año
40.559
+0.361
0.9%
1 ene 1977 año
40.876
+0.317
0.78%
1 ene 1978 año
41.141
+0.265
0.65%
1 ene 1979 año
41.355
+0.214
0.52%
1 ene 1980 año
41.522
+0.167
0.4%
1 ene 1981 año
41.661
+0.139
0.33%
1 ene 1982 año
41.794
+0.133
0.32%
1 ene 1983 año
41.941
+0.147
0.35%
1 ene 1984 año
42.114
+0.173
0.41%
1 ene 1985 año
42.315
+0.201
0.48%
1 ene 1986 año
42.53
+0.215
0.51%
1 ene 1987 año
42.736
+0.206
0.48%
1 ene 1988 año
42.911
+0.175
0.41%
1 ene 1989 año
43.045
+0.134
0.31%
1 ene 1990 año
43.139
+0.094
0.22%
1 ene 1991 año
43.203
+0.064
0.15%
1 ene 1992 año
43.25
+0.047
0.11%
1 ene 1993 año
43.307
+0.057
0.13%
1 ene 1994 año
43.402
+0.095
0.22%
1 ene 1995 año
43.554
+0.152
0.35%
1 ene 1996 año
43.796
+0.242
0.56%
1 ene 1997 año
44.155
+0.359
0.82%
1 ene 1998 año
44.632
+0.477
1.08%
1 ene 1999 año
45.215
+0.583
1.31%
1 ene 2000 año
45.888
+0.673
1.49%
1 ene 2001 año
46.621
+0.733
1.6%
1 ene 2002 año
47.374
+0.753
1.62%
1 ene 2003 año
48.109
+0.735
1.55%
1 ene 2004 año
48.793
+0.684
1.42%
1 ene 2005 año
49.41
+0.617
1.26%
1 ene 2006 año
49.954
+0.544
1.1%
1 ene 2007 año
50.433
+0.479
0.96%
1 ene 2008 año
50.875
+0.442
0.88%
1 ene 2009 año
51.301
+0.426
0.84%
1 ene 2010 año
51.72
+0.419
0.82%
1 ene 2011 año
52.138
+0.418
0.81%
1 ene 2012 año
52.558
+0.42
0.81%
1 ene 2013 año
52.976
+0.418
0.8%
1 ene 2014 año
53.392
+0.416
0.79%
1 ene 2015 año
53.805
+0.413
0.77%
Ranking de los países por los datos estadísticos actuales


Comentarios: