29
/es/
es
AIzaSyAYiBZKx7MnpbEhh9jyipgxe19OcubqV5w
April 1, 2024
286118
Zambia
ZMB
true
2
1
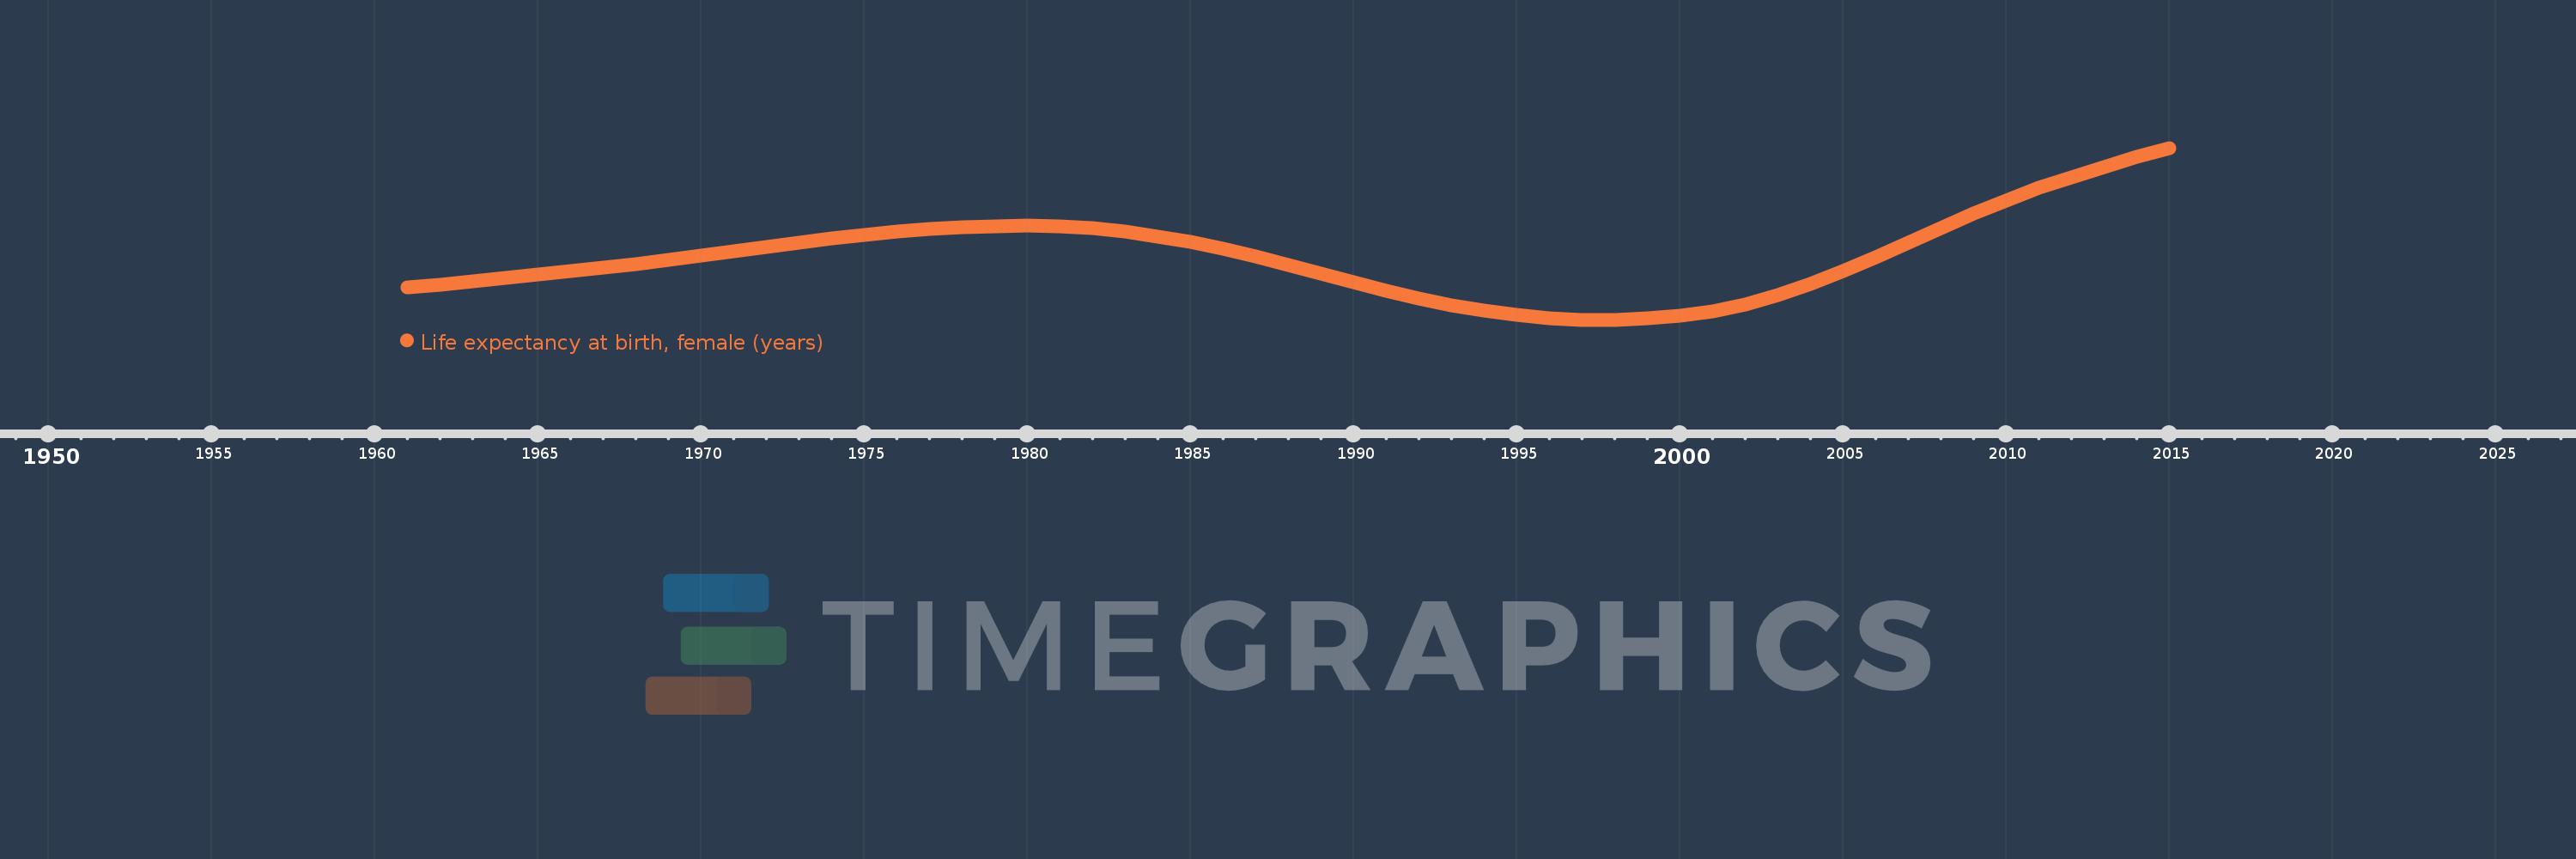
Life expectancy at birth, female (years)
2015,2014,2013,2012,2011,2010,2009,2008,2007,2006,2005,2004,2003,2002,2001,2000,1999,1998,1997,1996,1995,1994,1993,1992,1991,1990,1989,1988,1987,1986,1985,1984,1983,1982,1981,1980,1979,1978,1977,1976,1975,1974,1973,1972,1971,1970,1969,1968,1967,1966,1965,1964,1963,1962,1961
Estas estadísticas en otros países:
AfghanistanAlbaniaAlgeriaAngolaAntigua and BarbudaArab WorldArgentinaArmeniaArubaAustraliaAustriaAzerbaijanBahamas, TheBahrainBangladeshBarbadosBelarusBelgiumBelizeBeninBermudaBhutanBoliviaBosnia and HerzegovinaBotswanaBrazilBrunei DarussalamBulgariaBurkina FasoBurundiCabo VerdeCambodiaCameroonCanadaCaribbean small statesCentral African RepublicCentral Europe and the BalticsChadChannel IslandsChileChinaColombiaComorosCongo, Dem. Rep.Congo, Rep.Costa RicaCote d'IvoireCroatiaCubaCuracaoCyprusCzech RepublicDenmarkDjiboutiDominicaDominican RepublicEarly-demographic dividendEast Asia & PacificEast Asia & Pacific (excluding high income)East Asia & Pacific (IDA & IBRD countries)EcuadorEgypt, Arab Rep.El SalvadorEquatorial GuineaEritreaEstoniaEthiopiaEuro areaEurope & Central AsiaEurope & Central Asia (excluding high income)Europe & Central Asia (IDA & IBRD countries)European UnionFaroe IslandsFijiFinlandFragile and conflict affected situationsFranceFrench PolynesiaGabonGambia, TheGeorgiaGermanyGhanaGreeceGreenlandGrenadaGuamGuatemalaGuineaGuinea-BissauGuyanaHaitiHeavily indebted poor countries (HIPC)High incomeHondurasHong Kong SAR, ChinaHungaryIBRD onlyIcelandIDA & IBRD totalIDA blendIDA onlyIDA totalIndiaIndonesiaIran, Islamic Rep.IraqIrelandIsle of ManIsraelItalyJamaicaJapanJordanKazakhstanKenyaKiribatiKorea, Dem. People’s Rep.Korea, Rep.KosovoKuwaitKyrgyz RepublicLao PDRLate-demographic dividendLatin America & Caribbean Latin America & Caribbean (excluding high income)Latin America & the Caribbean (IDA & IBRD countries)LatviaLeast developed countries: UN classificationLebanonLesothoLiberiaLibyaLiechtensteinLithuaniaLow & middle incomeLow incomeLower middle incomeLuxembourgMacao SAR, ChinaMacedonia, FYRMadagascarMalawiMalaysiaMaldivesMaliMaltaMarshall IslandsMauritaniaMauritiusMexicoMicronesia, Fed. Sts.Middle East & North AfricaMiddle East & North Africa (excluding high income)Middle East & North Africa (IDA & IBRD countries)Middle incomeMoldovaMongoliaMontenegroMoroccoMozambiqueMyanmarNamibiaNepalNetherlandsNew CaledoniaNew ZealandNicaraguaNigerNigeriaNorth AmericaNorwayOECD membersOmanOther small statesPacific island small statesPakistanPalauPanamaPapua New GuineaParaguayPeruPhilippinesPolandPortugalPost-demographic dividendPre-demographic dividendPuerto RicoQatarRomaniaRussian FederationRwandaSamoaSan MarinoSao Tome and PrincipeSaudi ArabiaSenegalSerbiaSeychellesSierra LeoneSingaporeSint Maarten (Dutch part)Slovak RepublicSloveniaSmall statesSolomon IslandsSomaliaSouth AfricaSouth AsiaSouth Asia (IDA & IBRD)South SudanSpainSri LankaSt. Kitts and NevisSt. LuciaSt. Martin (French part)St. Vincent and the GrenadinesSub-Saharan Africa Sub-Saharan Africa (excluding high income)Sub-Saharan Africa (IDA & IBRD countries)SudanSurinameSwazilandSwedenSwitzerlandSyrian Arab RepublicTajikistanTanzaniaThailandTimor-LesteTogoTongaTrinidad and TobagoTunisiaTurkeyTurkmenistanUgandaUkraineUnited Arab EmiratesUnited KingdomUnited StatesUpper middle incomeUruguayUzbekistanVanuatuVenezuela, RBVietnamVirgin Islands (U.S.)West Bank and GazaWorldYemen, Rep.ZambiaZimbabwe línea de tiempo (timeline):
En esta escala de tiempo se presenta un gráfico de 1961 y 2015 de Zambia. Los datos de 1960 están ausentes. El número de observaciones reales por fecha: 55.
Fuente (nombre):
Indicadores del desarrollo mundial
Fuente (organización):
(1) United Nations Population Division. World Population Prospects, (2) Census reports and other statistical publications from national statistical offices, (3) Eurostat: Demographic Statistics, (4) United Nations Statistical Division. Population and Vital Statistics Reprot (various years), (5) U.S. Census Bureau: International Database, and (6) Secretariat of the Pacific Community: Statistics and Demography Programme.
Categorías:
Health, Gender, Social Development
Se ha actualizado:
23 abr 2017 año
Los indicadores de los cambios de valor en los últimos años
Mínimo:
43.179
1 ene 1998 año
Máximo:
61.956
1 ene 2015 año
A la fecha de observación
Valor
Cambio absoluto
El cambio con respecto al valor anterior
1 ene 1961 año
46.672
+46.672
0.0%
1 ene 1962 año
47.041
+0.369
0.79%
1 ene 1963 año
47.401
+0.36
0.77%
1 ene 1964 año
47.753
+0.352
0.74%
1 ene 1965 año
48.104
+0.351
0.74%
1 ene 1966 año
48.465
+0.361
0.75%
1 ene 1967 año
48.847
+0.382
0.79%
1 ene 1968 año
49.258
+0.411
0.84%
1 ene 1969 año
49.697
+0.439
0.89%
1 ene 1970 año
50.159
+0.462
0.93%
1 ene 1971 año
50.637
+0.478
0.95%
1 ene 1972 año
51.123
+0.486
0.96%
1 ene 1973 año
51.6
+0.477
0.93%
1 ene 1974 año
52.048
+0.448
0.87%
1 ene 1975 año
52.45
+0.402
0.77%
1 ene 1976 año
52.794
+0.344
0.66%
1 ene 1977 año
53.074
+0.28
0.53%
1 ene 1978 año
53.285
+0.211
0.4%
1 ene 1979 año
53.418
+0.133
0.25%
1 ene 1980 año
53.458
+0.04
0.07%
1 ene 1981 año
53.381
-0.077
-0.14%
1 ene 1982 año
53.164
-0.217
-0.41%
1 ene 1983 año
52.802
-0.362
-0.68%
1 ene 1984 año
52.301
-0.501
-0.95%
1 ene 1985 año
51.673
-0.628
-1.2%
1 ene 1986 año
50.927
-0.746
-1.44%
1 ene 1987 año
50.074
-0.853
-1.67%
1 ene 1988 año
49.147
-0.927
-1.85%
1 ene 1989 año
48.187
-0.96
-1.95%
1 ene 1990 año
47.235
-0.952
-1.98%
1 ene 1991 año
46.33
-0.905
-1.92%
1 ene 1992 año
45.5
-0.83
-1.79%
1 ene 1993 año
44.764
-0.736
-1.62%
1 ene 1994 año
44.145
-0.619
-1.38%
1 ene 1995 año
43.668
-0.477
-1.08%
1 ene 1996 año
43.349
-0.319
-0.73%
1 ene 1997 año
43.188
-0.161
-0.37%
1 ene 1998 año
43.179
-0.009
-0.02%
1 ene 1999 año
43.319
+0.14
0.32%
1 ene 2000 año
43.621
+0.302
0.7%
1 ene 2001 año
44.121
+0.5
1.15%
1 ene 2002 año
44.861
+0.74
1.68%
1 ene 2003 año
45.846
+0.985
2.2%
1 ene 2004 año
47.058
+1.212
2.64%
1 ene 2005 año
48.462
+1.404
2.98%
1 ene 2006 año
50.001
+1.539
3.18%
1 ene 2007 año
51.613
+1.612
3.22%
1 ene 2008 año
53.227
+1.614
3.13%
1 ene 2009 año
54.782
+1.555
2.92%
1 ene 2010 año
56.236
+1.454
2.65%
1 ene 2011 año
57.566
+1.33
2.37%
1 ene 2012 año
58.779
+1.213
2.11%
1 ene 2013 año
59.904
+1.125
1.91%
1 ene 2014 año
60.965
+1.061
1.77%
1 ene 2015 año
61.956
+0.991
1.63%
Ranking de los países por los datos estadísticos actuales


Comentarios: