29
/es/
es
AIzaSyAYiBZKx7MnpbEhh9jyipgxe19OcubqV5w
April 1, 2024
96795
Burundi
BDI
true
2
1
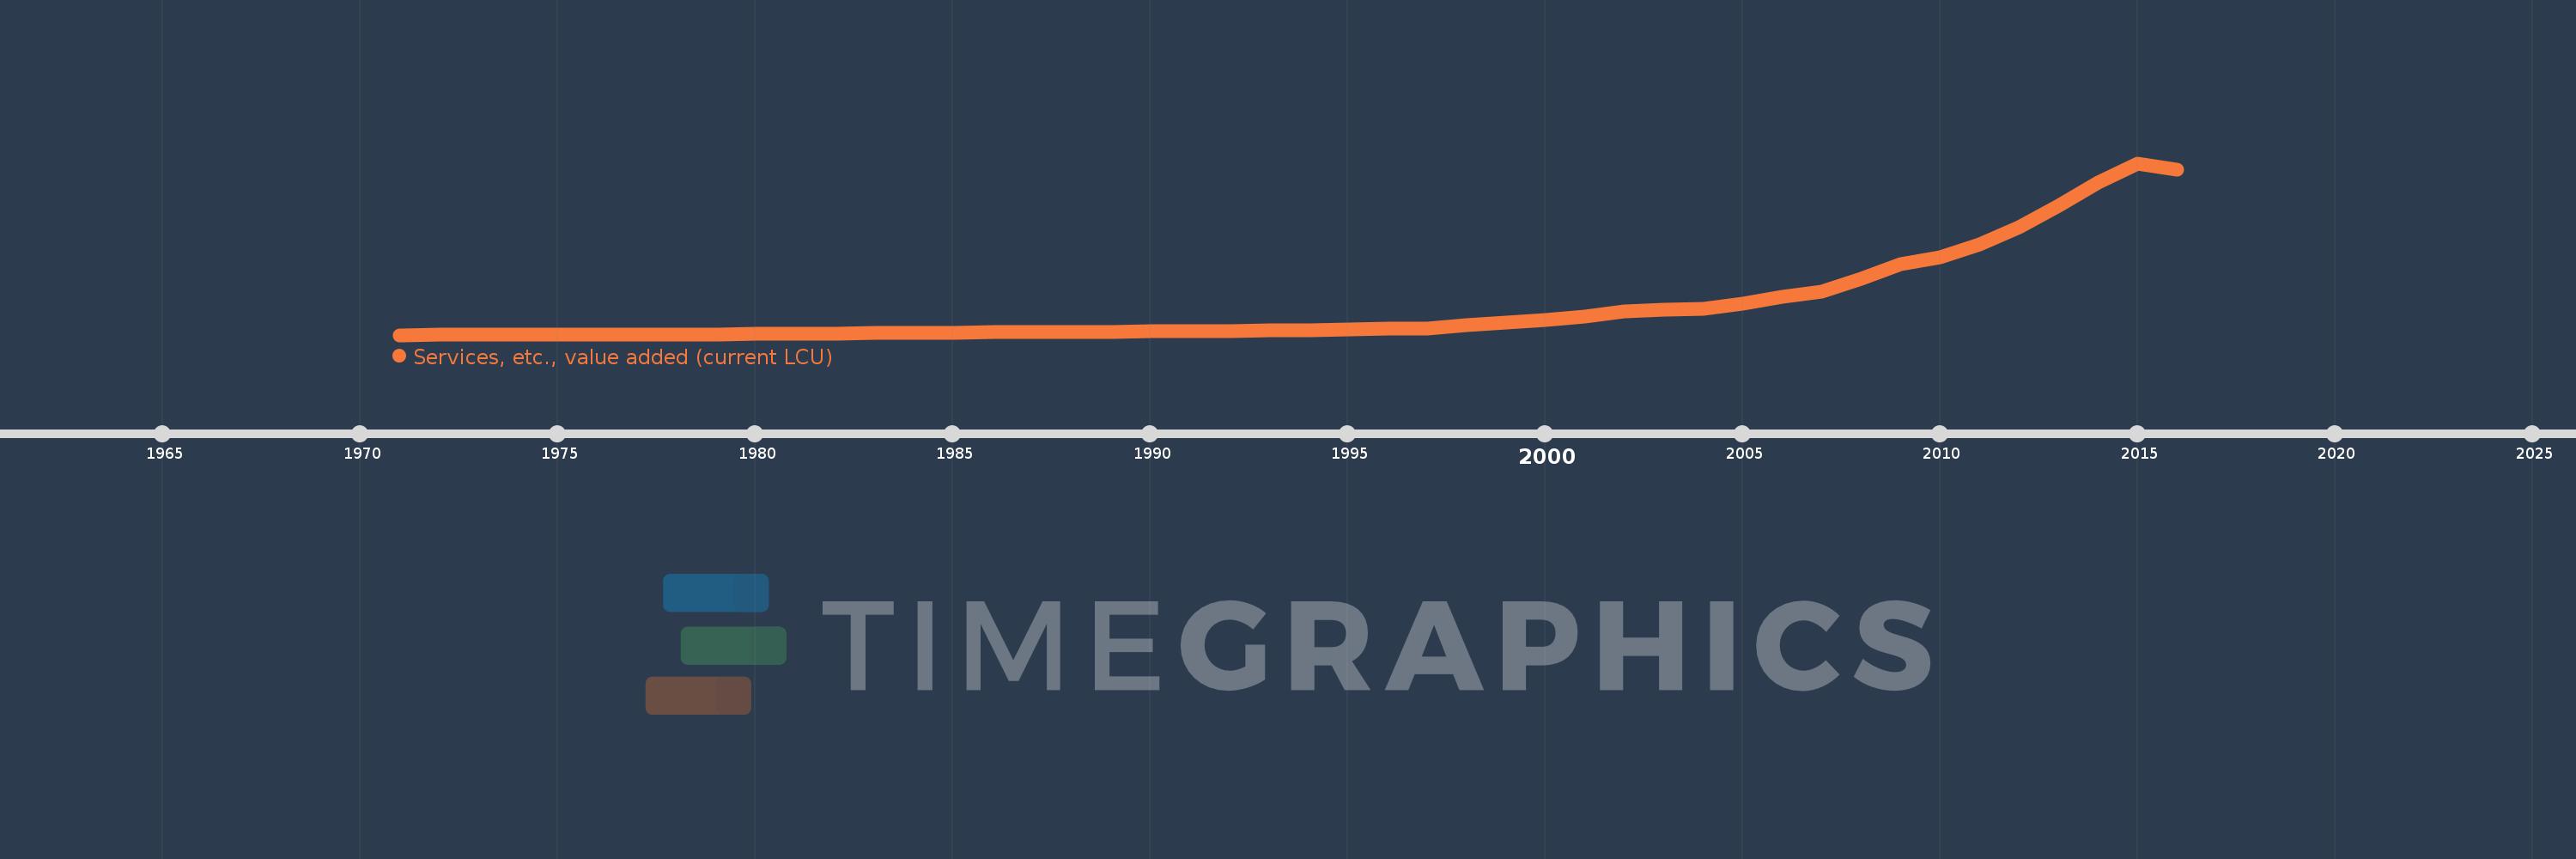
Services, etc., value added (current LCU)
2016,2015,2014,2013,2012,2011,2010,2009,2008,2007,2006,2005,2004,2003,2002,2001,2000,1999,1998,1997,1996,1995,1994,1993,1992,1991,1990,1989,1988,1987,1986,1985,1984,1983,1982,1981,1980,1979,1978,1977,1976,1975,1974,1973,1972,1971
Estas estadísticas en otros países:
AfghanistanAlbaniaAlgeriaAndorraAngolaAntigua and BarbudaArgentinaArmeniaArubaAustraliaAustriaAzerbaijanBahamas, TheBahrainBangladeshBarbadosBelarusBelgiumBelizeBeninBermudaBhutanBoliviaBosnia and HerzegovinaBotswanaBrazilBrunei DarussalamBulgariaBurkina FasoBurundiCabo VerdeCambodiaCameroonCanadaCentral African RepublicChadChileChinaColombiaComorosCongo, Dem. Rep.Congo, Rep.Costa RicaCote d'IvoireCroatiaCubaCyprusCzech RepublicDenmarkDjiboutiDominicaDominican RepublicEcuadorEgypt, Arab Rep.El SalvadorEquatorial GuineaEritreaEstoniaEthiopiaFaroe IslandsFijiFinlandFranceGabonGambia, TheGeorgiaGermanyGhanaGreeceGrenadaGuatemalaGuineaGuinea-BissauGuyanaHondurasHong Kong SAR, ChinaHungaryIcelandIndiaIndonesiaIran, Islamic Rep.IraqIrelandItalyJamaicaJapanJordanKazakhstanKenyaKiribatiKorea, Rep.KosovoKuwaitKyrgyz RepublicLao PDRLatviaLebanonLesothoLiberiaLibyaLithuaniaLuxembourgMacao SAR, ChinaMacedonia, FYRMadagascarMalawiMalaysiaMaldivesMaliMaltaMarshall IslandsMauritaniaMauritiusMexicoMicronesia, Fed. Sts.MoldovaMongoliaMontenegroMoroccoMozambiqueMyanmarNamibiaNepalNetherlandsNew CaledoniaNew ZealandNicaraguaNigerNigeriaNorwayOmanPakistanPalauPanamaPapua New GuineaParaguayPeruPhilippinesPolandPortugalPuerto RicoQatarRomaniaRussian FederationRwandaSamoaSao Tome and PrincipeSaudi ArabiaSenegalSerbiaSeychellesSierra LeoneSingaporeSlovak RepublicSloveniaSolomon IslandsSomaliaSouth AfricaSpainSri LankaSt. Kitts and NevisSt. LuciaSt. Vincent and the GrenadinesSudanSurinameSwazilandSwedenSwitzerlandSyrian Arab RepublicTajikistanTanzaniaThailandTimor-LesteTogoTongaTrinidad and TobagoTunisiaTurkeyTurkmenistanTuvaluUgandaUkraineUnited Arab EmiratesUnited KingdomUnited StatesUruguayUzbekistanVanuatuVenezuela, RBVietnamWest Bank and GazaYemen, Rep.ZambiaZimbabwe línea de tiempo (timeline):
En esta escala de tiempo se presenta un gráfico de 1971 y 2016 de Burundi. Los datos de 1970 están ausentes. El número de observaciones reales por fecha: 46.
Fuente (nombre):
Indicadores del desarrollo mundial
Fuente (organización):
World Bank national accounts data, and OECD National Accounts data files.
Categorías:
Economy & Growth
Se ha actualizado:
23 abr 2017 año
Los indicadores de los cambios de valor en los últimos años
Mínimo:
3.772 bn
1 ene 1971 año
Máximo:
1.844 billones
1 ene 2015 año
A la fecha de observación
Valor
Cambio absoluto
El cambio con respecto al valor anterior
1 ene 1971 año
3.772 bn
+3.772 bn
0.0%
1 ene 1972 año
4.2 bn
+428.1 millones
11.35%
1 ene 1973 año
4.636 bn
+435.3 millones
10.36%
1 ene 1974 año
4.439 bn
-196.2 millones
-4.23%
1 ene 1975 año
5.304 bn
+864.8 millones
19.48%
1 ene 1976 año
6.453 bn
+1.149 bn
21.66%
1 ene 1977 año
7.959 bn
+1.506 bn
23.34%
1 ene 1978 año
9.508 bn
+1.549 bn
19.46%
1 ene 1979 año
11.32 bn
+1.812 bn
19.06%
1 ene 1980 año
14.262 bn
+2.943 bn
26.0%
1 ene 1981 año
19.239 bn
+4.977 bn
34.89%
1 ene 1982 año
20.897 bn
+1.658 bn
8.62%
1 ene 1983 año
23.371 bn
+2.474 bn
11.84%
1 ene 1984 año
25.629 bn
+2.258 bn
9.66%
1 ene 1985 año
27.96 bn
+2.331 bn
9.09%
1 ene 1986 año
32.13 bn
+4.17 bn
14.91%
1 ene 1987 año
34.425 bn
+2.295 bn
7.14%
1 ene 1988 año
35.604 bn
+1.179 bn
3.43%
1 ene 1989 año
39.29 bn
+3.686 bn
10.35%
1 ene 1990 año
41.359 bn
+2.069 bn
5.27%
1 ene 1991 año
44.567 bn
+3.208 bn
7.76%
1 ene 1992 año
49.475 bn
+4.908 bn
11.01%
1 ene 1993 año
51.169 bn
+1.694 bn
3.42%
1 ene 1994 año
50.939 bn
-230.629 millones
-0.45%
1 ene 1995 año
62.568 bn
+11.629 bn
22.83%
1 ene 1996 año
71.114 bn
+8.546 bn
13.66%
1 ene 1997 año
73.996 bn
+2.882 bn
4.05%
1 ene 1998 año
111.657 bn
+37.661 bn
50.9%
1 ene 1999 año
134.06 bn
+22.403 bn
20.06%
1 ene 2000 año
162.639 bn
+28.579 bn
21.32%
1 ene 2001 año
201.556 bn
+38.917 bn
23.93%
1 ene 2002 año
254.806 bn
+53.25 bn
26.42%
1 ene 2003 año
272.769 bn
+17.963 bn
7.05%
1 ene 2004 año
287.351 bn
+14.582 bn
5.35%
1 ene 2005 año
342.387 bn
+55.037 bn
19.15%
1 ene 2006 año
411.0 bn
+68.613 bn
20.04%
1 ene 2007 año
467.5 bn
+56.5 bn
13.75%
1 ene 2008 año
602.4 bn
+134.9 bn
28.86%
1 ene 2009 año
761.3 bn
+158.9 bn
26.38%
1 ene 2010 año
836.822 bn
+75.522 bn
9.92%
1 ene 2011 año
976.902 bn
+140.08 bn
16.74%
1 ene 2012 año
1.162 billones
+184.69 bn
18.91%
1 ene 2013 año
1.386 billones
+223.973 bn
19.28%
1 ene 2014 año
1.633 billones
+247.835 bn
17.89%
1 ene 2015 año
1.844 billones
+211.001 bn
12.92%
1 ene 2016 año
1.772 billones
-72.65 bn
-3.94%
Ranking de los países por los datos estadísticos actuales


Comentarios: