30
/es/
AIzaSyAYiBZKx7MnpbEhh9jyipgxe19OcubqV5w
April 1, 2024
159897
Ireland
IRL
true
2
1
Services, etc., value added (current LCU)
2016,2015,2014,2013,2012,2011,2010,2009,2008,2007,2006,2005,2004,2003,2002,2001,2000,1999,1998,1997,1996
Download
Estadísticas Globales de la Biblioteca →Ireland →

Services, etc., value added (current LCU)

Estas estadísticas en otros países:

AfghanistanAlbaniaAlgeriaAndorraAngolaAntigua and BarbudaArgentinaArmeniaArubaAustraliaAustriaAzerbaijanBahamas, TheBahrainBangladeshBarbadosBelarusBelgiumBelizeBeninBermudaBhutanBoliviaBosnia and HerzegovinaBotswanaBrazilBrunei DarussalamBulgariaBurkina FasoBurundiCabo VerdeCambodiaCameroonCanadaCentral African RepublicChadChileChinaColombiaComorosCongo, Dem. Rep.Congo, Rep.Costa RicaCote d'IvoireCroatiaCubaCyprusCzech RepublicDenmarkDjiboutiDominicaDominican RepublicEcuadorEgypt, Arab Rep.El SalvadorEquatorial GuineaEritreaEstoniaEthiopiaFaroe IslandsFijiFinlandFranceGabonGambia, TheGeorgiaGermanyGhanaGreeceGrenadaGuatemalaGuineaGuinea-BissauGuyanaHondurasHong Kong SAR, ChinaHungaryIcelandIndiaIndonesiaIran, Islamic Rep.IraqIrelandItalyJamaicaJapanJordanKazakhstanKenyaKiribatiKorea, Rep.KosovoKuwaitKyrgyz RepublicLao PDRLatviaLebanonLesothoLiberiaLibyaLithuaniaLuxembourgMacao SAR, ChinaMacedonia, FYRMadagascarMalawiMalaysiaMaldivesMaliMaltaMarshall IslandsMauritaniaMauritiusMexicoMicronesia, Fed. Sts.MoldovaMongoliaMontenegroMoroccoMozambiqueMyanmarNamibiaNepalNetherlandsNew CaledoniaNew ZealandNicaraguaNigerNigeriaNorwayOmanPakistanPalauPanamaPapua New GuineaParaguayPeruPhilippinesPolandPortugalPuerto RicoQatarRomaniaRussian FederationRwandaSamoaSao Tome and PrincipeSaudi ArabiaSenegalSerbiaSeychellesSierra LeoneSingaporeSlovak RepublicSloveniaSolomon IslandsSomaliaSouth AfricaSpainSri LankaSt. Kitts and NevisSt. LuciaSt. Vincent and the GrenadinesSudanSurinameSwazilandSwedenSwitzerlandSyrian Arab RepublicTajikistanTanzaniaThailandTimor-LesteTogoTongaTrinidad and TobagoTunisiaTurkeyTurkmenistanTuvaluUgandaUkraineUnited Arab EmiratesUnited KingdomUnited StatesUruguayUzbekistanVanuatuVenezuela, RBVietnamWest Bank and GazaYemen, Rep.ZambiaZimbabwe

línea de tiempo (timeline):

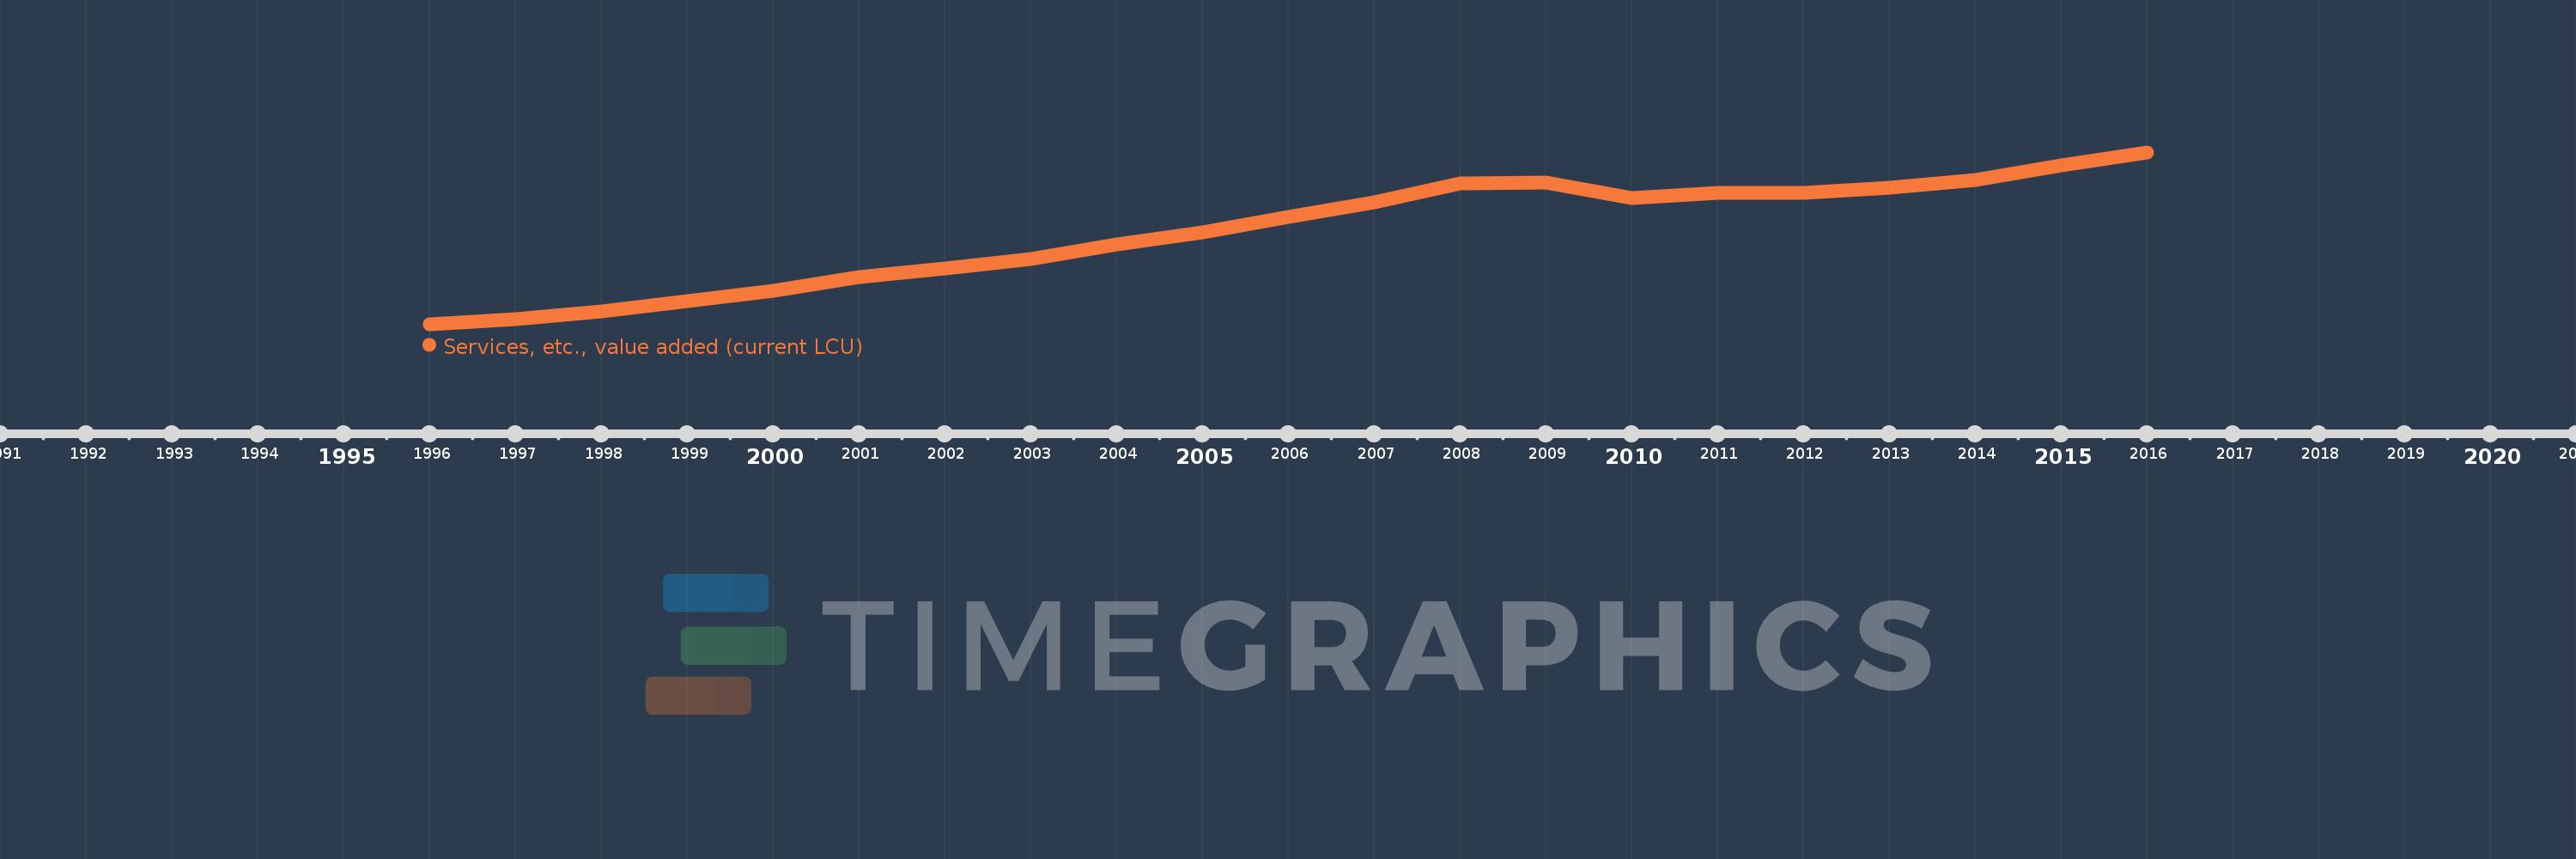
En esta escala de tiempo se presenta un gráfico de 1996 y 2016 de Ireland. Los datos de 1995 están ausentes. El número de observaciones reales por fecha: 21.

Fuente (nombre):

Indicadores del desarrollo mundial

Fuente (organización):

World Bank national accounts data, and OECD National Accounts data files.

Categorías:

Economy & Growth

Se ha actualizado:

23 abr 2017 año

Los indicadores de los cambios de valor en los últimos años

En promedio:
86.599 bn
Mínimo:
30.341 bn
1 ene 1996 año
Máximo:
135.773 bn
1 ene 2016 año
A la fecha de observación
Valor
Cambio absoluto
El cambio con respecto al valor anterior
1 ene 1996 año
30.341 bn
+30.341 bn
0.0%
1 ene 1997 año
33.45 bn
+3.109 bn
10.25%
1 ene 1998 año
38.354 bn
+4.904 bn
14.66%
1 ene 1999 año
44.547 bn
+6.194 bn
16.15%
1 ene 2000 año
50.869 bn
+6.322 bn
14.19%
1 ene 2001 año
59.495 bn
+8.625 bn
16.96%
1 ene 2002 año
64.427 bn
+4.933 bn
8.29%
1 ene 2003 año
70.221 bn
+5.794 bn
8.99%
1 ene 2004 año
79.552 bn
+9.331 bn
13.29%
1 ene 2005 año
86.51 bn
+6.958 bn
8.75%
1 ene 2006 año
96.088 bn
+9.578 bn
11.07%
1 ene 2007 año
104.919 bn
+8.831 bn
9.19%
1 ene 2008 año
116.517 bn
+11.598 bn
11.05%
1 ene 2009 año
117.153 bn
+635.371 millones
0.55%
1 ene 2010 año
107.901 bn
-9.252 bn
-7.9%
1 ene 2011 año
110.698 bn
+2.797 bn
2.59%
1 ene 2012 año
111.133 bn
+434.341 millones
0.39%
1 ene 2013 año
114.165 bn
+3.032 bn
2.73%
1 ene 2014 año
118.902 bn
+4.737 bn
4.15%
1 ene 2015 año
127.572 bn
+8.671 bn
7.29%
1 ene 2016 año
135.773 bn
+8.2 bn
6.43%

Ranking de los países por los datos estadísticos actuales