30
/es/
AIzaSyAYiBZKx7MnpbEhh9jyipgxe19OcubqV5w
April 1, 2024
142326
Greece
GRC
true
2
1
Services, etc., value added (current LCU)
2016,2015,2014,2013,2012,2011,2010,2009,2008,2007,2006,2005,2004,2003,2002,2001,2000,1999,1998,1997,1996
Download
Estadísticas Globales de la Biblioteca →Greece →

Services, etc., value added (current LCU)

Estas estadísticas en otros países:

AfghanistanAlbaniaAlgeriaAndorraAngolaAntigua and BarbudaArgentinaArmeniaArubaAustraliaAustriaAzerbaijanBahamas, TheBahrainBangladeshBarbadosBelarusBelgiumBelizeBeninBermudaBhutanBoliviaBosnia and HerzegovinaBotswanaBrazilBrunei DarussalamBulgariaBurkina FasoBurundiCabo VerdeCambodiaCameroonCanadaCentral African RepublicChadChileChinaColombiaComorosCongo, Dem. Rep.Congo, Rep.Costa RicaCote d'IvoireCroatiaCubaCyprusCzech RepublicDenmarkDjiboutiDominicaDominican RepublicEcuadorEgypt, Arab Rep.El SalvadorEquatorial GuineaEritreaEstoniaEthiopiaFaroe IslandsFijiFinlandFranceGabonGambia, TheGeorgiaGermanyGhanaGreeceGrenadaGuatemalaGuineaGuinea-BissauGuyanaHondurasHong Kong SAR, ChinaHungaryIcelandIndiaIndonesiaIran, Islamic Rep.IraqIrelandItalyJamaicaJapanJordanKazakhstanKenyaKiribatiKorea, Rep.KosovoKuwaitKyrgyz RepublicLao PDRLatviaLebanonLesothoLiberiaLibyaLithuaniaLuxembourgMacao SAR, ChinaMacedonia, FYRMadagascarMalawiMalaysiaMaldivesMaliMaltaMarshall IslandsMauritaniaMauritiusMexicoMicronesia, Fed. Sts.MoldovaMongoliaMontenegroMoroccoMozambiqueMyanmarNamibiaNepalNetherlandsNew CaledoniaNew ZealandNicaraguaNigerNigeriaNorwayOmanPakistanPalauPanamaPapua New GuineaParaguayPeruPhilippinesPolandPortugalPuerto RicoQatarRomaniaRussian FederationRwandaSamoaSao Tome and PrincipeSaudi ArabiaSenegalSerbiaSeychellesSierra LeoneSingaporeSlovak RepublicSloveniaSolomon IslandsSomaliaSouth AfricaSpainSri LankaSt. Kitts and NevisSt. LuciaSt. Vincent and the GrenadinesSudanSurinameSwazilandSwedenSwitzerlandSyrian Arab RepublicTajikistanTanzaniaThailandTimor-LesteTogoTongaTrinidad and TobagoTunisiaTurkeyTurkmenistanTuvaluUgandaUkraineUnited Arab EmiratesUnited KingdomUnited StatesUruguayUzbekistanVanuatuVenezuela, RBVietnamWest Bank and GazaYemen, Rep.ZambiaZimbabwe

línea de tiempo (timeline):

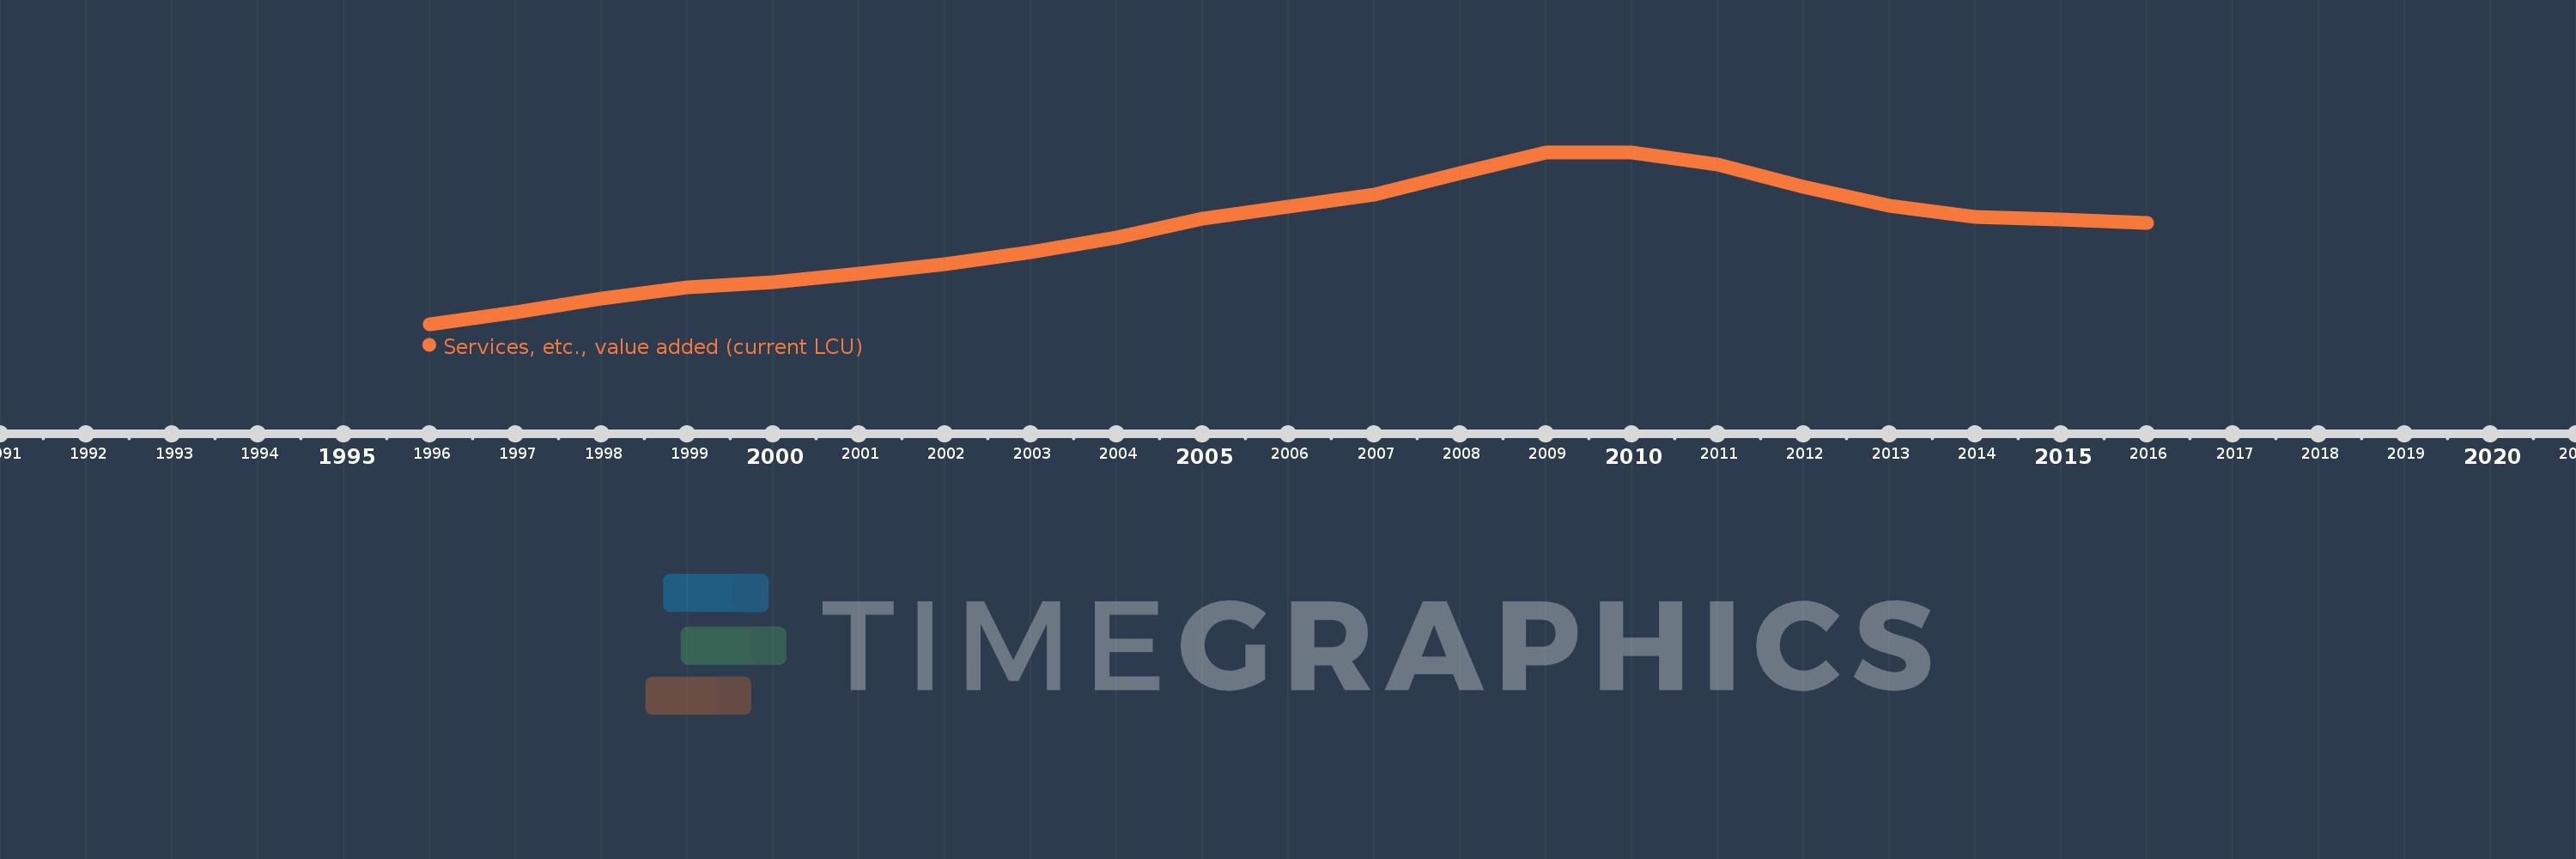
En esta escala de tiempo se presenta un gráfico de 1996 y 2016 de Greece. Los datos de 1995 están ausentes. El número de observaciones reales por fecha: 21.

Fuente (nombre):

Indicadores del desarrollo mundial

Fuente (organización):

World Bank national accounts data, and OECD National Accounts data files.

Categorías:

Economy & Growth

Se ha actualizado:

23 abr 2017 año

Los indicadores de los cambios de valor en los últimos años

En promedio:
119.313 bn
Mínimo:
59.561 bn
1 ene 1996 año
Máximo:
169.353 bn
1 ene 2010 año
A la fecha de observación
Valor
Cambio absoluto
El cambio con respecto al valor anterior
1 ene 1996 año
59.561 bn
+59.561 bn
0.0%
1 ene 1997 año
67.053 bn
+7.492 bn
12.58%
1 ene 1998 año
75.705 bn
+8.652 bn
12.9%
1 ene 1999 año
83.153 bn
+7.449 bn
9.84%
1 ene 2000 año
86.633 bn
+3.48 bn
4.19%
1 ene 2001 año
92.024 bn
+5.39 bn
6.22%
1 ene 2002 año
98.129 bn
+6.105 bn
6.63%
1 ene 2003 año
105.871 bn
+7.742 bn
7.89%
1 ene 2004 año
114.862 bn
+8.991 bn
8.49%
1 ene 2005 año
127.081 bn
+12.22 bn
10.64%
1 ene 2006 año
134.81 bn
+7.729 bn
6.08%
1 ene 2007 año
142.528 bn
+7.718 bn
5.72%
1 ene 2008 año
156.318 bn
+13.79 bn
9.68%
1 ene 2009 año
169.13 bn
+12.812 bn
8.2%
1 ene 2010 año
169.353 bn
+222.984 millones
0.13%
1 ene 2011 año
161.87 bn
-7.484 bn
-4.42%
1 ene 2012 año
147.474 bn
-14.396 bn
-8.89%
1 ene 2013 año
135.397 bn
-12.078 bn
-8.19%
1 ene 2014 año
127.951 bn
-7.445 bn
-5.5%
1 ene 2015 año
126.296 bn
-1.655 bn
-1.29%
1 ene 2016 año
124.377 bn
-1.919 bn
-1.52%

Ranking de los países por los datos estadísticos actuales