29
/es/
es
AIzaSyAYiBZKx7MnpbEhh9jyipgxe19OcubqV5w
April 1, 2024
70518
Argentina
ARG
true
2
1
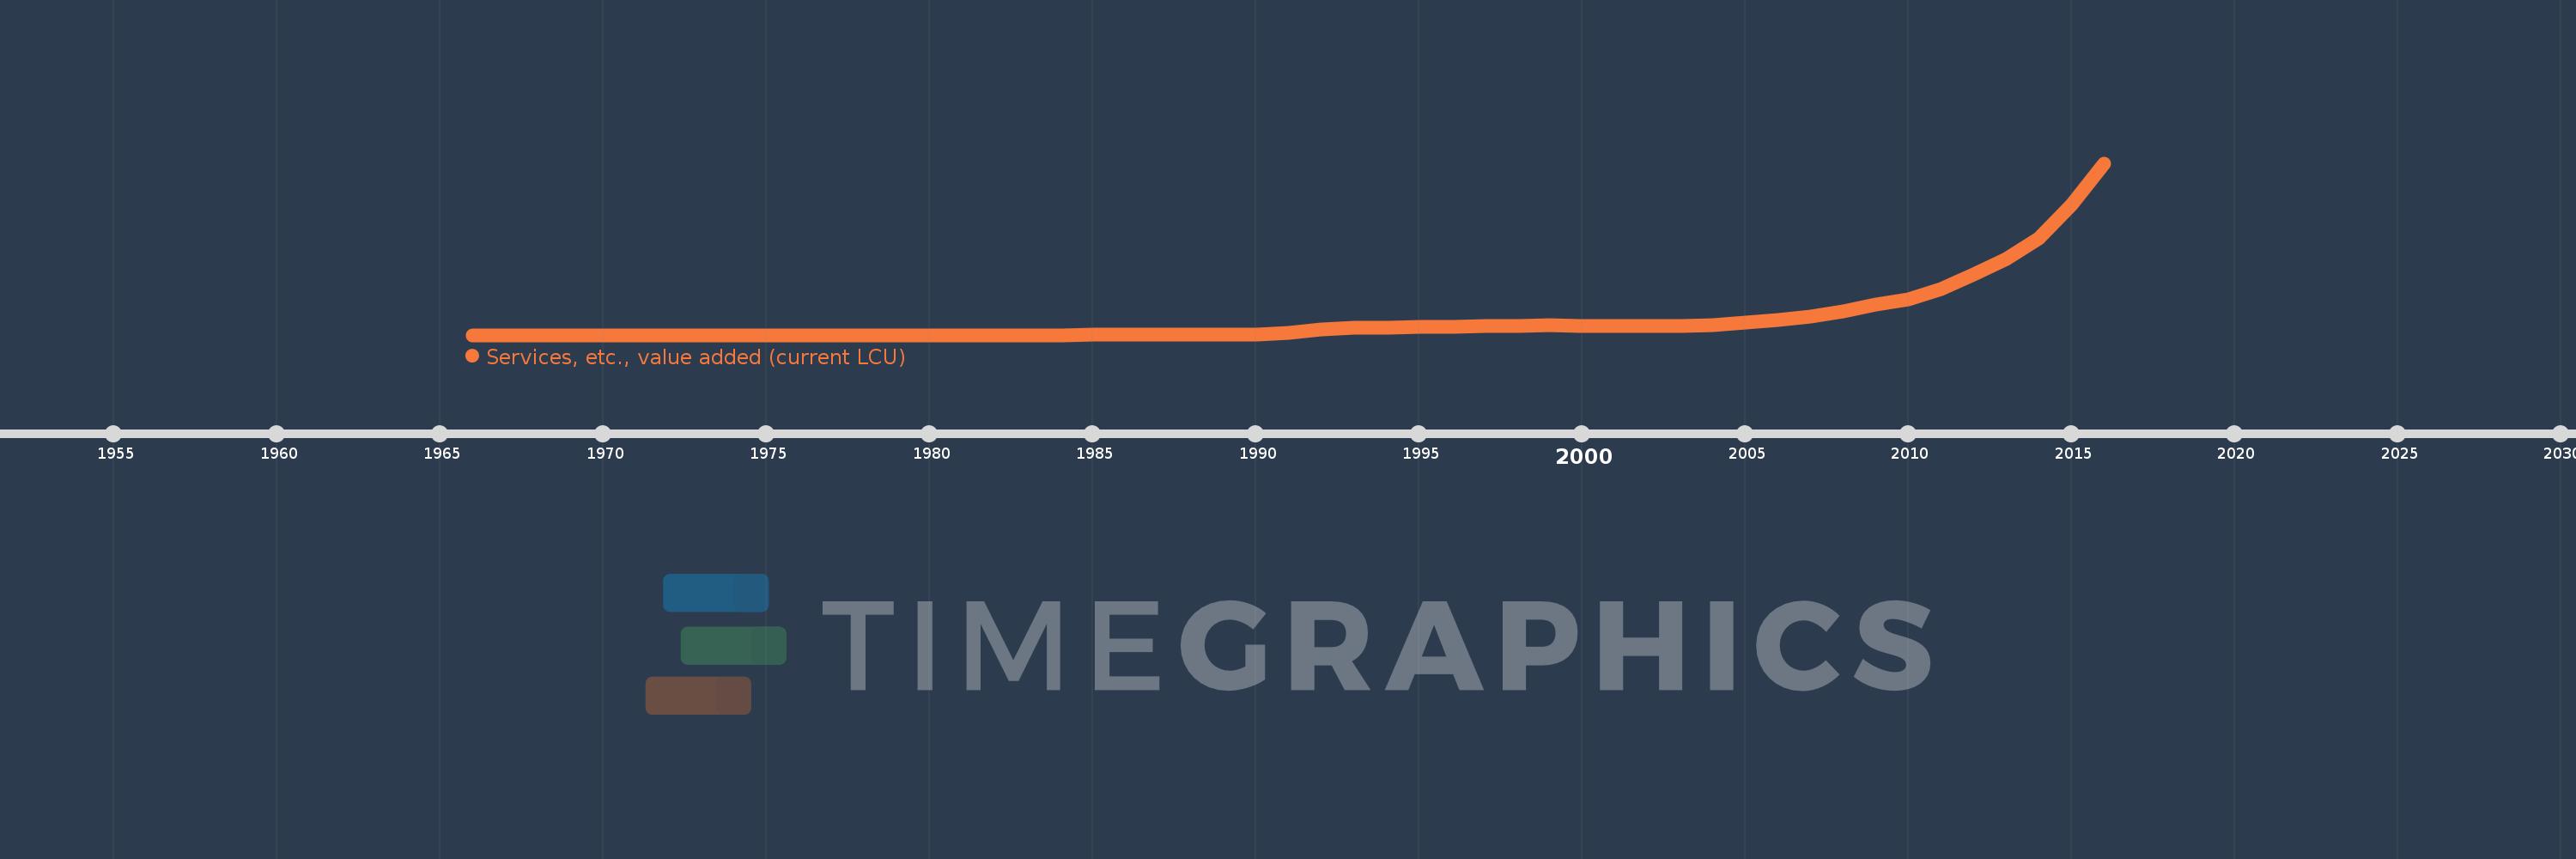
Services, etc., value added (current LCU)
2016,2015,2014,2013,2012,2011,2010,2009,2008,2007,2006,2005,2004,2003,2002,2001,2000,1999,1998,1997,1996,1995,1994,1993,1992,1991,1990,1989,1988,1987,1986,1985,1984,1983,1982,1981,1980,1979,1978,1977,1976,1975,1974,1973,1972,1971,1970,1969,1968,1967,1966
Estas estadísticas en otros países:
AfghanistanAlbaniaAlgeriaAndorraAngolaAntigua and BarbudaArgentinaArmeniaArubaAustraliaAustriaAzerbaijanBahamas, TheBahrainBangladeshBarbadosBelarusBelgiumBelizeBeninBermudaBhutanBoliviaBosnia and HerzegovinaBotswanaBrazilBrunei DarussalamBulgariaBurkina FasoBurundiCabo VerdeCambodiaCameroonCanadaCentral African RepublicChadChileChinaColombiaComorosCongo, Dem. Rep.Congo, Rep.Costa RicaCote d'IvoireCroatiaCubaCyprusCzech RepublicDenmarkDjiboutiDominicaDominican RepublicEcuadorEgypt, Arab Rep.El SalvadorEquatorial GuineaEritreaEstoniaEthiopiaFaroe IslandsFijiFinlandFranceGabonGambia, TheGeorgiaGermanyGhanaGreeceGrenadaGuatemalaGuineaGuinea-BissauGuyanaHondurasHong Kong SAR, ChinaHungaryIcelandIndiaIndonesiaIran, Islamic Rep.IraqIrelandItalyJamaicaJapanJordanKazakhstanKenyaKiribatiKorea, Rep.KosovoKuwaitKyrgyz RepublicLao PDRLatviaLebanonLesothoLiberiaLibyaLithuaniaLuxembourgMacao SAR, ChinaMacedonia, FYRMadagascarMalawiMalaysiaMaldivesMaliMaltaMarshall IslandsMauritaniaMauritiusMexicoMicronesia, Fed. Sts.MoldovaMongoliaMontenegroMoroccoMozambiqueMyanmarNamibiaNepalNetherlandsNew CaledoniaNew ZealandNicaraguaNigerNigeriaNorwayOmanPakistanPalauPanamaPapua New GuineaParaguayPeruPhilippinesPolandPortugalPuerto RicoQatarRomaniaRussian FederationRwandaSamoaSao Tome and PrincipeSaudi ArabiaSenegalSerbiaSeychellesSierra LeoneSingaporeSlovak RepublicSloveniaSolomon IslandsSomaliaSouth AfricaSpainSri LankaSt. Kitts and NevisSt. LuciaSt. Vincent and the GrenadinesSudanSurinameSwazilandSwedenSwitzerlandSyrian Arab RepublicTajikistanTanzaniaThailandTimor-LesteTogoTongaTrinidad and TobagoTunisiaTurkeyTurkmenistanTuvaluUgandaUkraineUnited Arab EmiratesUnited KingdomUnited StatesUruguayUzbekistanVanuatuVenezuela, RBVietnamWest Bank and GazaYemen, Rep.ZambiaZimbabwe línea de tiempo (timeline):
En esta escala de tiempo se presenta un gráfico de 1966 y 2016 de Argentina. Los datos de 1965 están ausentes. El número de observaciones reales por fecha: 51.
Fuente (nombre):
Indicadores del desarrollo mundial
Fuente (organización):
World Bank national accounts data, and OECD National Accounts data files.
Categorías:
Economy & Growth
Se ha actualizado:
23 abr 2017 año
Los indicadores de los cambios de valor en los últimos años
Mínimo:
0.186
1 ene 1966 año
Máximo:
3.241 billones
1 ene 2016 año
A la fecha de observación
Valor
Cambio absoluto
El cambio con respecto al valor anterior
1 ene 1966 año
0.186
+0.186
0.0%
1 ene 1967 año
0.241
+0.055
29.41%
1 ene 1968 año
0.341
+0.1
41.5%
1 ene 1969 año
0.4
+0.059
17.24%
1 ene 1970 año
0.475
+0.075
18.73%
1 ene 1971 año
0.577
+0.102
21.47%
1 ene 1972 año
0.719
+0.142
24.55%
1 ene 1973 año
1.207
+0.488
67.9%
1 ene 1974 año
2.114
+0.907
75.13%
1 ene 1975 año
3.01
+0.897
42.43%
1 ene 1976 año
8.396
+5.386
178.91%
1 ene 1977 año
41.912
+33.516
399.17%
1 ene 1978 año
125.221
+83.309
198.77%
1 ene 1979 año
328.781
+203.56
162.56%
1 ene 1980 año
930.82
+602.039
183.11%
1 ene 1981 año
2.013 mil
+1.083 mil
116.3%
1 ene 1982 año
3.975 mil
+1.962 mil
97.44%
1 ene 1983 año
10.774 mil
+6.798 mil
171.01%
1 ene 1984 año
54.51 mil
+43.736 mil
405.96%
1 ene 1985 año
410.85 mil
+356.34 mil
653.71%
1 ene 1986 año
2.816 millones
+2.406 millones
585.51%
1 ene 1987 año
5.473 millones
+2.657 millones
94.33%
1 ene 1988 año
12.617 millones
+7.144 millones
130.53%
1 ene 1989 año
58.347 millones
+45.73 millones
362.43%
1 ene 1990 año
1.558 bn
+1.5 bn
2.57 mil%
1 ene 1991 año
38.496 bn
+36.938 bn
2.37 mil%
1 ene 1992 año
109.554 bn
+71.058 bn
184.59%
1 ene 1993 año
143.519 bn
+33.965 bn
31.0%
1 ene 1994 año
144.403 bn
+883.589 millones
0.62%
1 ene 1995 año
155.345 bn
+10.942 bn
7.58%
1 ene 1996 año
156.939 bn
+1.594 bn
1.03%
1 ene 1997 año
163.458 bn
+6.519 bn
4.15%
1 ene 1998 año
174.668 bn
+11.21 bn
6.86%
1 ene 1999 año
179.791 bn
+5.123 bn
2.93%
1 ene 2000 año
175.571 bn
-4.22 bn
-2.35%
1 ene 2001 año
176.051 bn
+480.0 millones
0.27%
1 ene 2002 año
170.785 bn
-5.266 bn
-2.99%
1 ene 2003 año
167.383 bn
-3.402 bn
-1.99%
1 ene 2004 año
190.059 bn
+22.675 bn
13.55%
1 ene 2005 año
232.182 bn
+42.124 bn
22.16%
1 ene 2006 año
284.786 bn
+52.604 bn
22.66%
1 ene 2007 año
352.257 bn
+67.471 bn
23.69%
1 ene 2008 año
448.221 bn
+95.964 bn
27.24%
1 ene 2009 año
582.915 bn
+134.694 bn
30.05%
1 ene 2010 año
671.061 bn
+88.147 bn
15.12%
1 ene 2011 año
864.987 bn
+193.925 bn
28.9%
1 ene 2012 año
1.142 billones
+276.622 bn
31.98%
1 ene 2013 año
1.43 billones
+288.436 bn
25.27%
1 ene 2014 año
1.816 billones
+386.395 bn
27.02%
1 ene 2015 año
2.454 billones
+637.479 bn
35.09%
1 ene 2016 año
3.241 billones
+787.31 bn
32.08%
Ranking de los países por los datos estadísticos actuales


Comentarios: