29
/es/
es
AIzaSyAYiBZKx7MnpbEhh9jyipgxe19OcubqV5w
April 1, 2024
96370
Burundi
BDI
true
2
1
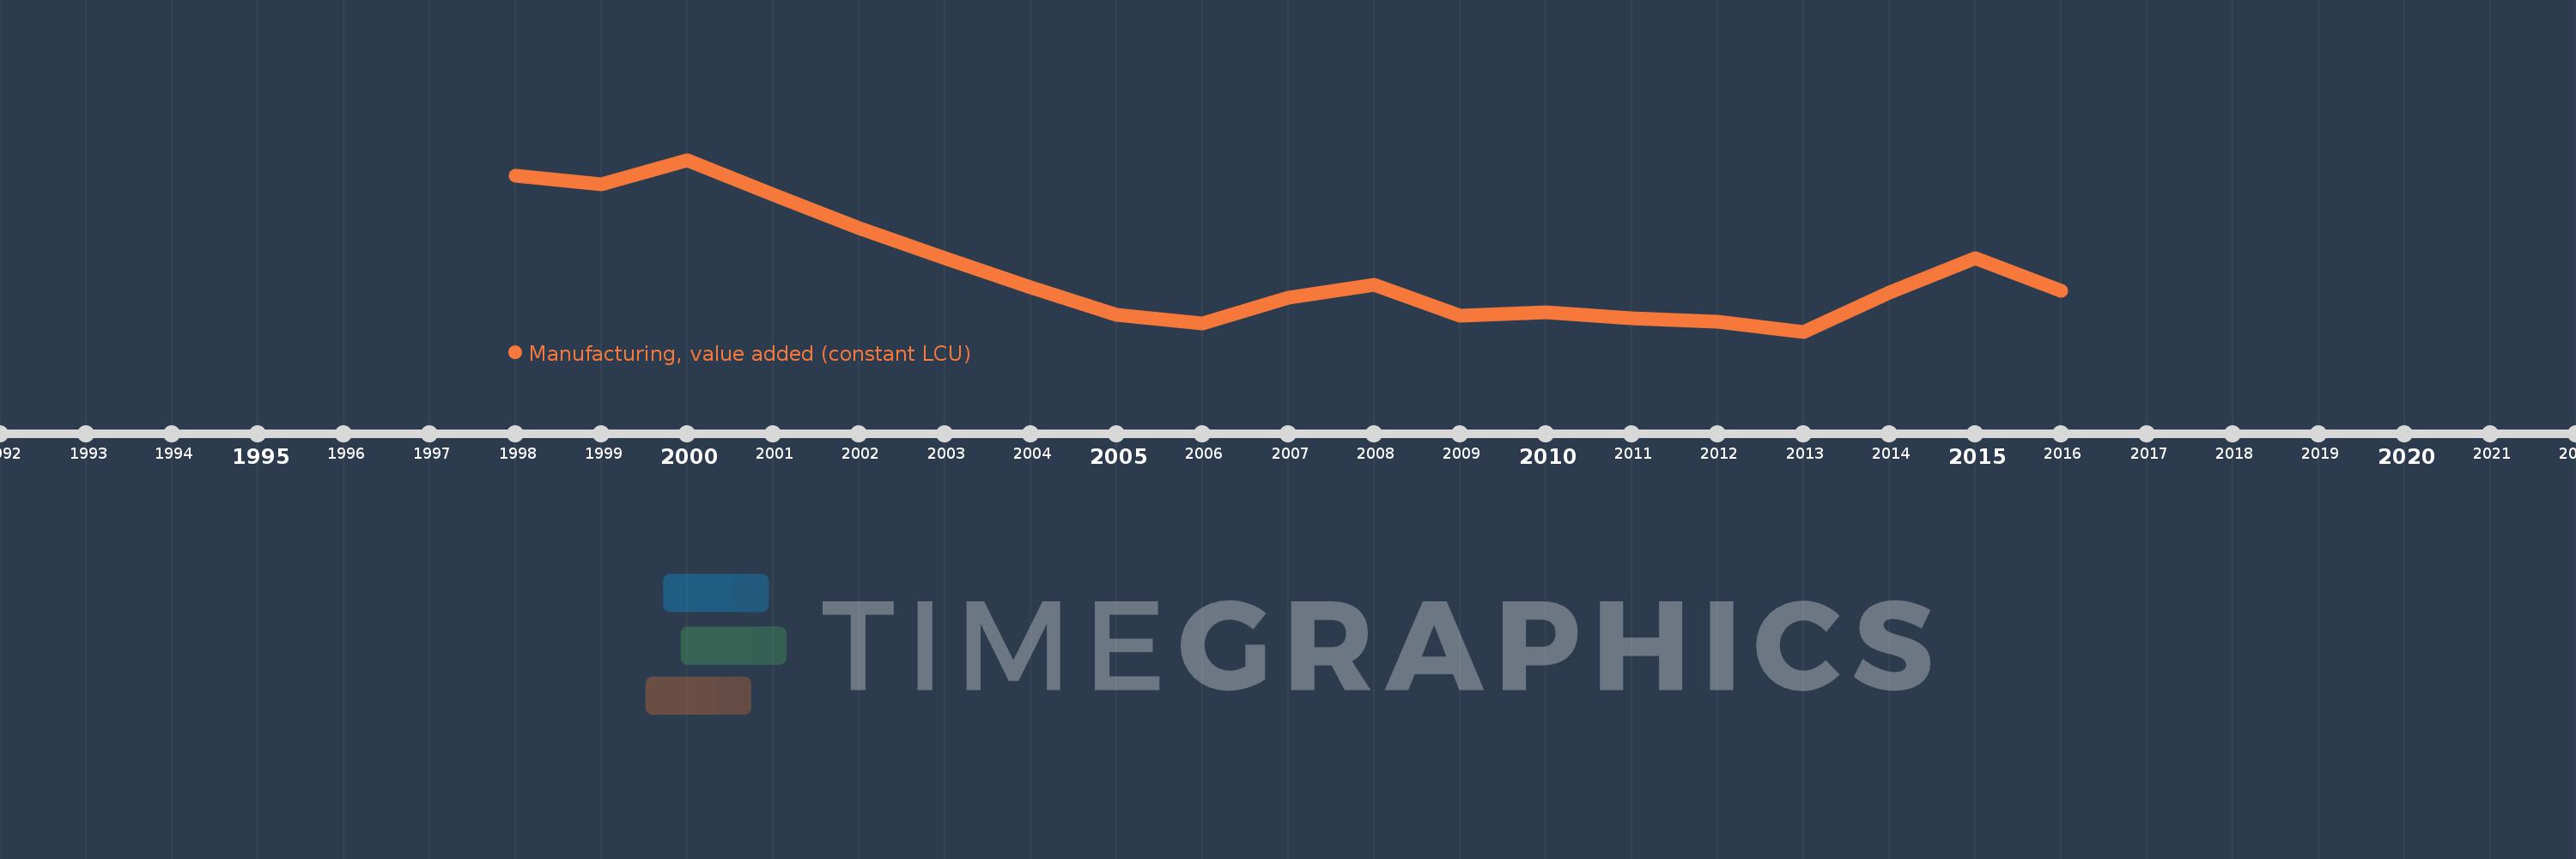
Manufacturing, value added (constant LCU)
2016,2015,2014,2013,2012,2011,2010,2009,2008,2007,2006,2005,2004,2003,2002,2001,2000,1999,1998
Estas estadísticas en otros países:
AfghanistanAlbaniaAlgeriaAntigua and BarbudaArgentinaArmeniaAustraliaAustriaAzerbaijanBahamas, TheBahrainBangladeshBelarusBelgiumBelizeBeninBermudaBhutanBoliviaBosnia and HerzegovinaBotswanaBrazilBrunei DarussalamBurkina FasoBurundiCabo VerdeCambodiaCameroonCanadaCayman IslandsCentral African RepublicChadChileColombiaComorosCongo, Dem. Rep.Congo, Rep.Costa RicaCote d'IvoireCroatiaCubaCyprusCzech RepublicDenmarkDjiboutiDominicaDominican RepublicEcuadorEgypt, Arab Rep.El SalvadorEquatorial GuineaEritreaEstoniaEthiopiaFijiFinlandFranceGabonGambia, TheGeorgiaGermanyGhanaGreeceGrenadaGuatemalaGuineaGuyanaHaitiHondurasHong Kong SAR, ChinaHungaryIcelandIndiaIndonesiaIran, Islamic Rep.IraqIrelandItalyJamaicaJapanJordanKazakhstanKenyaKiribatiKorea, Rep.KosovoKuwaitKyrgyz RepublicLao PDRLatviaLebanonLesothoLiberiaLibyaLithuaniaLuxembourgMacedonia, FYRMadagascarMalawiMalaysiaMaldivesMarshall IslandsMauritaniaMauritiusMexicoMicronesia, Fed. Sts.MoldovaMongoliaMontenegroMoroccoMozambiqueMyanmarNamibiaNepalNetherlandsNew ZealandNicaraguaNigerNigeriaNorwayOmanPakistanPalauPanamaPapua New GuineaParaguayPeruPhilippinesPolandPortugalPuerto RicoQatarRomaniaRussian FederationRwandaSamoaSao Tome and PrincipeSaudi ArabiaSenegalSerbiaSeychellesSierra LeoneSingaporeSlovak RepublicSloveniaSolomon IslandsSomaliaSouth AfricaSpainSri LankaSt. Kitts and NevisSt. LuciaSt. Vincent and the GrenadinesSudanSurinameSwazilandSwedenSwitzerlandSyrian Arab RepublicTajikistanTanzaniaThailandTimor-LesteTogoTongaTrinidad and TobagoTunisiaTurkeyTuvaluUgandaUkraineUnited Arab EmiratesUnited KingdomUnited StatesUruguayUzbekistanVanuatuVenezuela, RBVietnamWest Bank and GazaZambiaZimbabwe línea de tiempo (timeline):
En esta escala de tiempo se presenta un gráfico de 1998 y 2016 de Burundi. Los datos de 1997 están ausentes. El número de observaciones reales por fecha: 19.
Fuente (nombre):
Indicadores del desarrollo mundial
Fuente (organización):
World Bank national accounts data, and OECD National Accounts data files.
Categorías:
Economy & Growth
Se ha actualizado:
23 abr 2017 año
Los indicadores de los cambios de valor en los últimos años
Mínimo:
140.651 bn
1 ene 2013 año
Máximo:
202.487 bn
1 ene 2000 año
A la fecha de observación
Valor
Cambio absoluto
El cambio con respecto al valor anterior
1 ene 1998 año
196.729 bn
+196.729 bn
0.0%
1 ene 1999 año
193.601 bn
-3.128 bn
-1.59%
1 ene 2000 año
202.487 bn
+8.886 bn
4.59%
1 ene 2001 año
189.872 bn
-12.615 bn
-6.23%
1 ene 2002 año
178.042 bn
-11.829 bn
-6.23%
1 ene 2003 año
166.95 bn
-11.092 bn
-6.23%
1 ene 2004 año
156.549 bn
-10.401 bn
-6.23%
1 ene 2005 año
146.796 bn
-9.753 bn
-6.23%
1 ene 2006 año
143.6 bn
-3.196 bn
-2.18%
1 ene 2007 año
152.79 bn
+9.19 bn
6.4%
1 ene 2008 año
157.374 bn
+4.584 bn
3.0%
1 ene 2009 año
146.358 bn
-11.016 bn
-7.0%
1 ene 2010 año
147.529 bn
+1.171 bn
0.8%
1 ene 2011 año
145.566 bn
-1.963 bn
-1.33%
1 ene 2012 año
144.11 bn
-1.456 bn
-1.0%
1 ene 2013 año
140.651 bn
-3.459 bn
-2.4%
1 ene 2014 año
154.717 bn
+14.065 bn
10.0%
1 ene 2015 año
167.094 bn
+12.377 bn
8.0%
1 ene 2016 año
155.397 bn
-11.697 bn
-7.0%
Ranking de los países por los datos estadísticos actuales


Comentarios: