29
/es/
es
AIzaSyAYiBZKx7MnpbEhh9jyipgxe19OcubqV5w
April 1, 2024
277928
Uruguay
URY
true
2
1
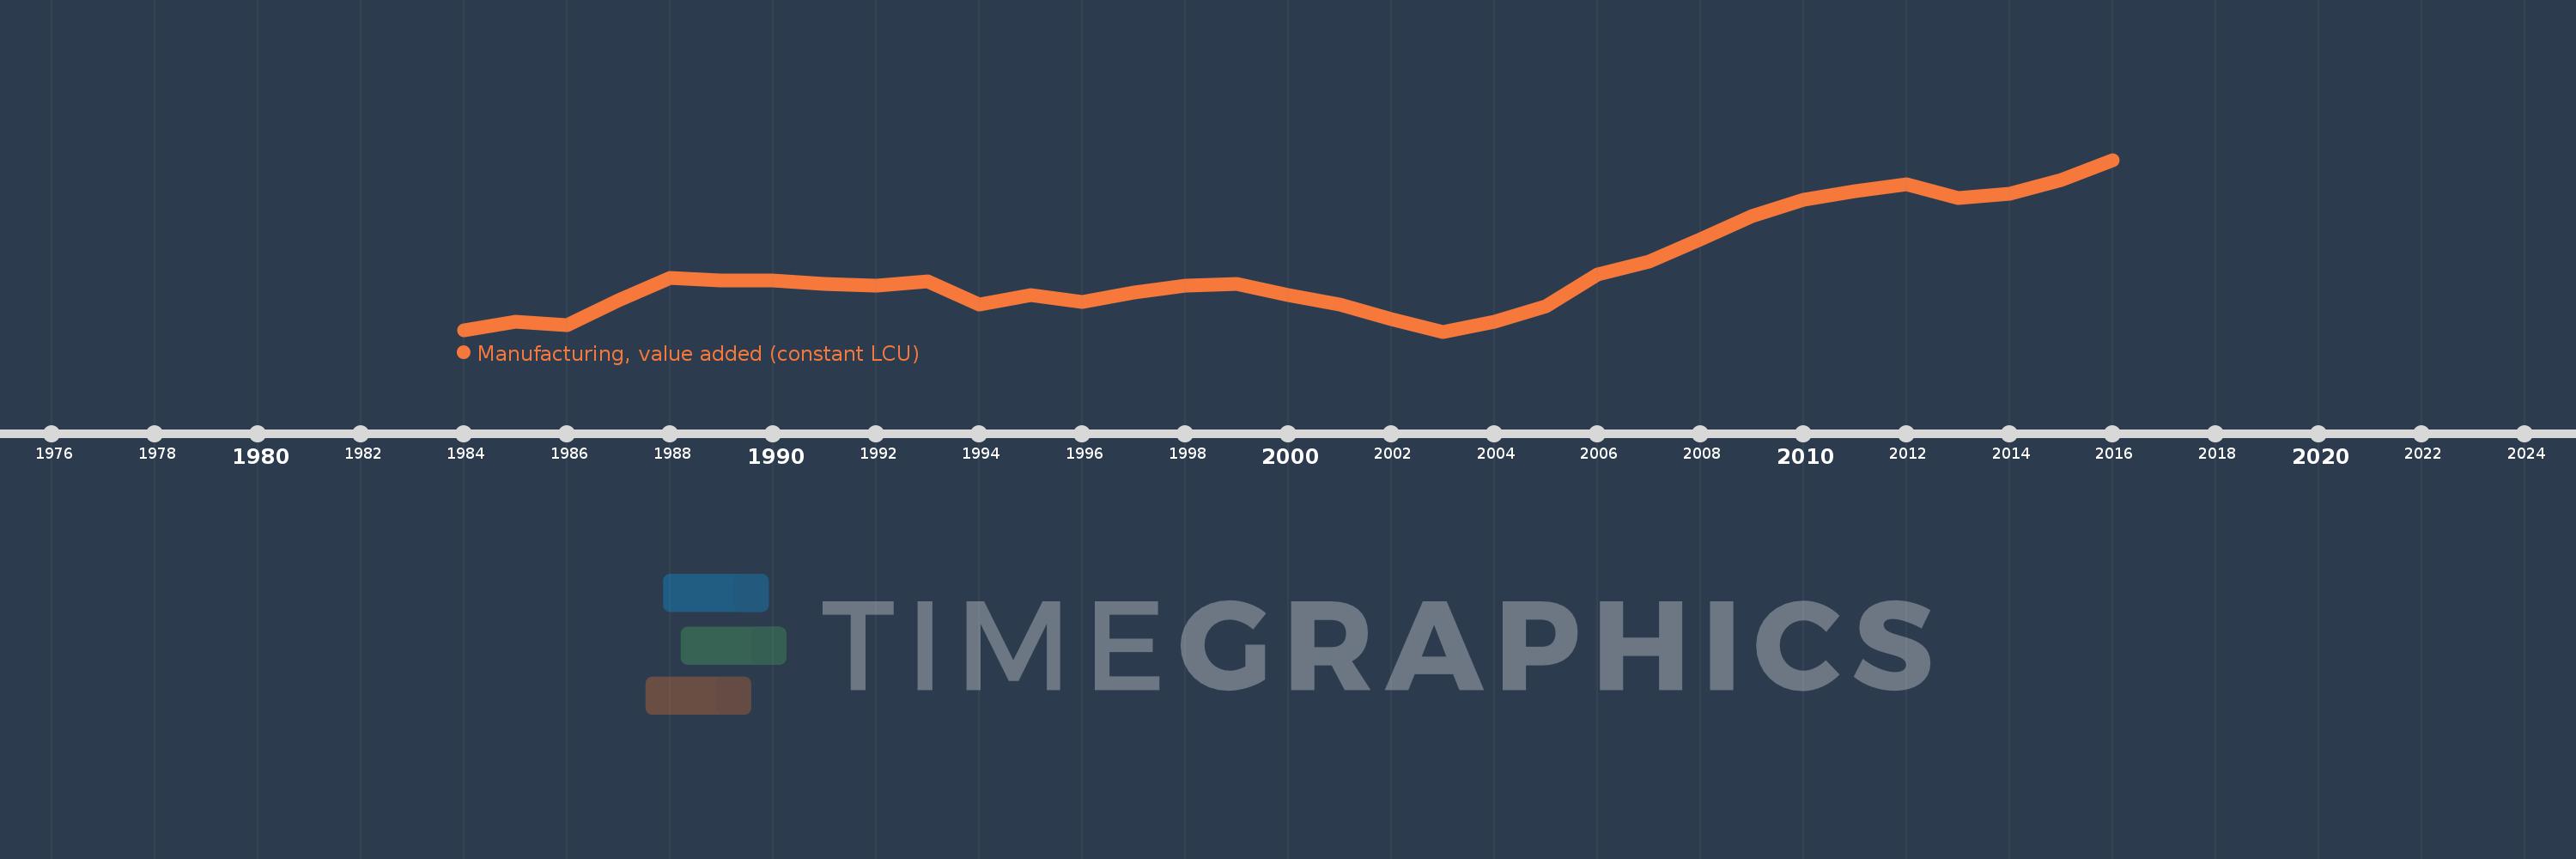
Manufacturing, value added (constant LCU)
2016,2015,2014,2013,2012,2011,2010,2009,2008,2007,2006,2005,2004,2003,2002,2001,2000,1999,1998,1997,1996,1995,1994,1993,1992,1991,1990,1989,1988,1987,1986,1985,1984
Estas estadísticas en otros países:
AfghanistanAlbaniaAlgeriaAntigua and BarbudaArgentinaArmeniaAustraliaAustriaAzerbaijanBahamas, TheBahrainBangladeshBelarusBelgiumBelizeBeninBermudaBhutanBoliviaBosnia and HerzegovinaBotswanaBrazilBrunei DarussalamBurkina FasoBurundiCabo VerdeCambodiaCameroonCanadaCayman IslandsCentral African RepublicChadChileColombiaComorosCongo, Dem. Rep.Congo, Rep.Costa RicaCote d'IvoireCroatiaCubaCyprusCzech RepublicDenmarkDjiboutiDominicaDominican RepublicEcuadorEgypt, Arab Rep.El SalvadorEquatorial GuineaEritreaEstoniaEthiopiaFijiFinlandFranceGabonGambia, TheGeorgiaGermanyGhanaGreeceGrenadaGuatemalaGuineaGuyanaHaitiHondurasHong Kong SAR, ChinaHungaryIcelandIndiaIndonesiaIran, Islamic Rep.IraqIrelandItalyJamaicaJapanJordanKazakhstanKenyaKiribatiKorea, Rep.KosovoKuwaitKyrgyz RepublicLao PDRLatviaLebanonLesothoLiberiaLibyaLithuaniaLuxembourgMacedonia, FYRMadagascarMalawiMalaysiaMaldivesMarshall IslandsMauritaniaMauritiusMexicoMicronesia, Fed. Sts.MoldovaMongoliaMontenegroMoroccoMozambiqueMyanmarNamibiaNepalNetherlandsNew ZealandNicaraguaNigerNigeriaNorwayOmanPakistanPalauPanamaPapua New GuineaParaguayPeruPhilippinesPolandPortugalPuerto RicoQatarRomaniaRussian FederationRwandaSamoaSao Tome and PrincipeSaudi ArabiaSenegalSerbiaSeychellesSierra LeoneSingaporeSlovak RepublicSloveniaSolomon IslandsSomaliaSouth AfricaSpainSri LankaSt. Kitts and NevisSt. LuciaSt. Vincent and the GrenadinesSudanSurinameSwazilandSwedenSwitzerlandSyrian Arab RepublicTajikistanTanzaniaThailandTimor-LesteTogoTongaTrinidad and TobagoTunisiaTurkeyTuvaluUgandaUkraineUnited Arab EmiratesUnited KingdomUnited StatesUruguayUzbekistanVanuatuVenezuela, RBVietnamWest Bank and GazaZambiaZimbabwe línea de tiempo (timeline):
En esta escala de tiempo se presenta un gráfico de 1984 y 2016 de Uruguay. Los datos de 1983 están ausentes. El número de observaciones reales por fecha: 33.
Fuente (nombre):
Indicadores del desarrollo mundial
Fuente (organización):
World Bank national accounts data, and OECD National Accounts data files.
Categorías:
Economy & Growth
Se ha actualizado:
23 abr 2017 año
Los indicadores de los cambios de valor en los últimos años
Mínimo:
49.056 bn
1 ene 2003 año
Máximo:
91.272 bn
1 ene 2016 año
A la fecha de observación
Valor
Cambio absoluto
El cambio con respecto al valor anterior
1 ene 1984 año
49.304 bn
+49.304 bn
0.0%
1 ene 1985 año
51.512 bn
+2.208 bn
4.48%
1 ene 1986 año
50.707 bn
-804.841 millones
-1.56%
1 ene 1987 año
56.658 bn
+5.951 bn
11.74%
1 ene 1988 año
62.303 bn
+5.645 bn
9.96%
1 ene 1989 año
61.712 bn
-590.882 millones
-0.95%
1 ene 1990 año
61.594 bn
-118.62 millones
-0.19%
1 ene 1991 año
60.696 bn
-897.963 millones
-1.46%
1 ene 1992 año
60.379 bn
-317.059 millones
-0.52%
1 ene 1993 año
61.301 bn
+922.353 millones
1.53%
1 ene 1994 año
55.793 bn
-5.508 bn
-8.98%
1 ene 1995 año
58.047 bn
+2.254 bn
4.04%
1 ene 1996 año
56.402 bn
-1.645 bn
-2.83%
1 ene 1997 año
58.665 bn
+2.263 bn
4.01%
1 ene 1998 año
60.382 bn
+1.717 bn
2.93%
1 ene 1999 año
60.704 bn
+321.435 millones
0.53%
1 ene 2000 año
57.925 bn
-2.779 bn
-4.58%
1 ene 2001 año
55.801 bn
-2.124 bn
-3.67%
1 ene 2002 año
52.013 bn
-3.787 bn
-6.79%
1 ene 2003 año
49.056 bn
-2.958 bn
-5.69%
1 ene 2004 año
51.45 bn
+2.394 bn
4.88%
1 ene 2005 año
55.298 bn
+3.848 bn
7.48%
1 ene 2006 año
63.126 bn
+7.828 bn
14.16%
1 ene 2007 año
66.154 bn
+3.028 bn
4.8%
1 ene 2008 año
71.647 bn
+5.493 bn
8.3%
1 ene 2009 año
77.476 bn
+5.83 bn
8.14%
1 ene 2010 año
81.538 bn
+4.061 bn
5.24%
1 ene 2011 año
83.623 bn
+2.086 bn
2.56%
1 ene 2012 año
85.277 bn
+1.653 bn
1.98%
1 ene 2013 año
81.908 bn
-3.368 bn
-3.95%
1 ene 2014 año
82.89 bn
+981.378 millones
1.2%
1 ene 2015 año
86.359 bn
+3.469 bn
4.18%
1 ene 2016 año
91.272 bn
+4.913 bn
5.69%
Ranking de los países por los datos estadísticos actuales


Comentarios: