29
/es/
es
AIzaSyAYiBZKx7MnpbEhh9jyipgxe19OcubqV5w
April 1, 2024
184135
Macedonia, FYR
MKD
true
2
1
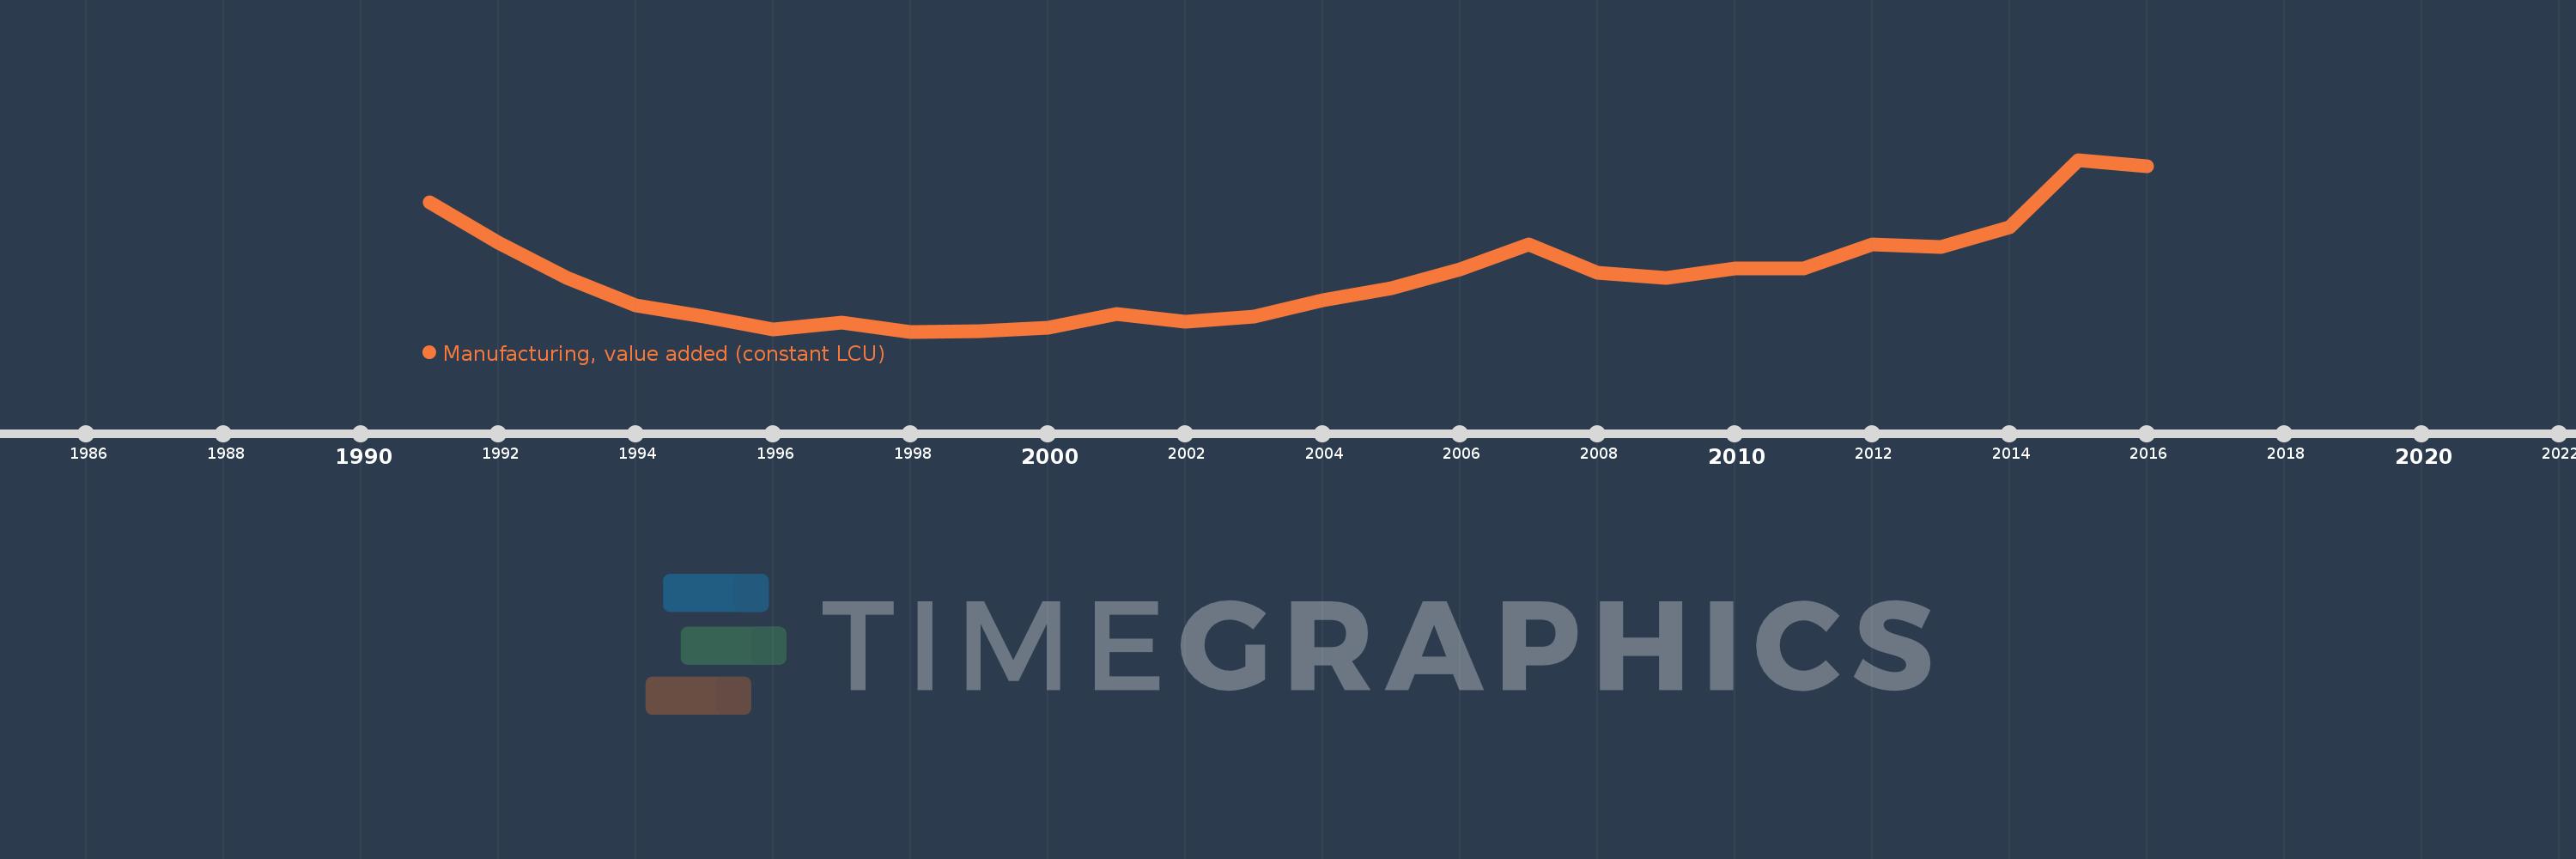
Manufacturing, value added (constant LCU)
2016,2015,2014,2013,2012,2011,2010,2009,2008,2007,2006,2005,2004,2003,2002,2001,2000,1999,1998,1997,1996,1995,1994,1993,1992,1991
Estas estadísticas en otros países:
AfghanistanAlbaniaAlgeriaAntigua and BarbudaArgentinaArmeniaAustraliaAustriaAzerbaijanBahamas, TheBahrainBangladeshBelarusBelgiumBelizeBeninBermudaBhutanBoliviaBosnia and HerzegovinaBotswanaBrazilBrunei DarussalamBurkina FasoBurundiCabo VerdeCambodiaCameroonCanadaCayman IslandsCentral African RepublicChadChileColombiaComorosCongo, Dem. Rep.Congo, Rep.Costa RicaCote d'IvoireCroatiaCubaCyprusCzech RepublicDenmarkDjiboutiDominicaDominican RepublicEcuadorEgypt, Arab Rep.El SalvadorEquatorial GuineaEritreaEstoniaEthiopiaFijiFinlandFranceGabonGambia, TheGeorgiaGermanyGhanaGreeceGrenadaGuatemalaGuineaGuyanaHaitiHondurasHong Kong SAR, ChinaHungaryIcelandIndiaIndonesiaIran, Islamic Rep.IraqIrelandItalyJamaicaJapanJordanKazakhstanKenyaKiribatiKorea, Rep.KosovoKuwaitKyrgyz RepublicLao PDRLatviaLebanonLesothoLiberiaLibyaLithuaniaLuxembourgMacedonia, FYRMadagascarMalawiMalaysiaMaldivesMarshall IslandsMauritaniaMauritiusMexicoMicronesia, Fed. Sts.MoldovaMongoliaMontenegroMoroccoMozambiqueMyanmarNamibiaNepalNetherlandsNew ZealandNicaraguaNigerNigeriaNorwayOmanPakistanPalauPanamaPapua New GuineaParaguayPeruPhilippinesPolandPortugalPuerto RicoQatarRomaniaRussian FederationRwandaSamoaSao Tome and PrincipeSaudi ArabiaSenegalSerbiaSeychellesSierra LeoneSingaporeSlovak RepublicSloveniaSolomon IslandsSomaliaSouth AfricaSpainSri LankaSt. Kitts and NevisSt. LuciaSt. Vincent and the GrenadinesSudanSurinameSwazilandSwedenSwitzerlandSyrian Arab RepublicTajikistanTanzaniaThailandTimor-LesteTogoTongaTrinidad and TobagoTunisiaTurkeyTuvaluUgandaUkraineUnited Arab EmiratesUnited KingdomUnited StatesUruguayUzbekistanVanuatuVenezuela, RBVietnamWest Bank and GazaZambiaZimbabwe línea de tiempo (timeline):
En esta escala de tiempo se presenta un gráfico de 1991 y 2016 de Macedonia, FYR. Los datos de 1990 están ausentes. El número de observaciones reales por fecha: 26.
Fuente (nombre):
Indicadores del desarrollo mundial
Fuente (organización):
World Bank national accounts data, and OECD National Accounts data files.
Categorías:
Economy & Growth
Se ha actualizado:
23 abr 2017 año
Los indicadores de los cambios de valor en los últimos años
Mínimo:
20.413 bn
1 ene 1998 año
Máximo:
46.431 bn
1 ene 2015 año
A la fecha de observación
Valor
Cambio absoluto
El cambio con respecto al valor anterior
1 ene 1991 año
39.995 bn
+39.995 bn
0.0%
1 ene 1992 año
33.908 bn
-6.088 bn
-15.22%
1 ene 1993 año
28.55 bn
-5.358 bn
-15.8%
1 ene 1994 año
24.438 bn
-4.112 bn
-14.4%
1 ene 1995 año
22.729 bn
-1.71 bn
-7.0%
1 ene 1996 año
20.703 bn
-2.026 bn
-8.91%
1 ene 1997 año
21.732 bn
+1.03 bn
4.97%
1 ene 1998 año
20.413 bn
-1.319 bn
-6.07%
1 ene 1999 año
20.515 bn
+102.029 millones
0.5%
1 ene 2000 año
21.017 bn
+502.058 millones
2.45%
1 ene 2001 año
23.144 bn
+2.126 bn
10.12%
1 ene 2002 año
21.915 bn
-1.229 bn
-5.31%
1 ene 2003 año
22.708 bn
+793.047 millones
3.62%
1 ene 2004 año
25.117 bn
+2.409 bn
10.61%
1 ene 2005 año
26.935 bn
+1.818 bn
7.24%
1 ene 2006 año
29.899 bn
+2.964 bn
11.01%
1 ene 2007 año
33.665 bn
+3.766 bn
12.6%
1 ene 2008 año
29.278 bn
-4.388 bn
-13.03%
1 ene 2009 año
28.571 bn
-706.266 millones
-2.41%
1 ene 2010 año
29.947 bn
+1.376 bn
4.82%
1 ene 2011 año
29.922 bn
-24.582 millones
-0.08%
1 ene 2012 año
33.624 bn
+3.702 bn
12.37%
1 ene 2013 año
33.215 bn
-409.087 millones
-1.22%
1 ene 2014 año
36.276 bn
+3.061 bn
9.22%
1 ene 2015 año
46.431 bn
+10.155 bn
27.99%
1 ene 2016 año
45.482 bn
-949.269 millones
-2.04%
Ranking de los países por los datos estadísticos actuales


Comentarios: