29
/es/
es
AIzaSyAYiBZKx7MnpbEhh9jyipgxe19OcubqV5w
April 1, 2024
273856
Ukraine
UKR
true
2
1
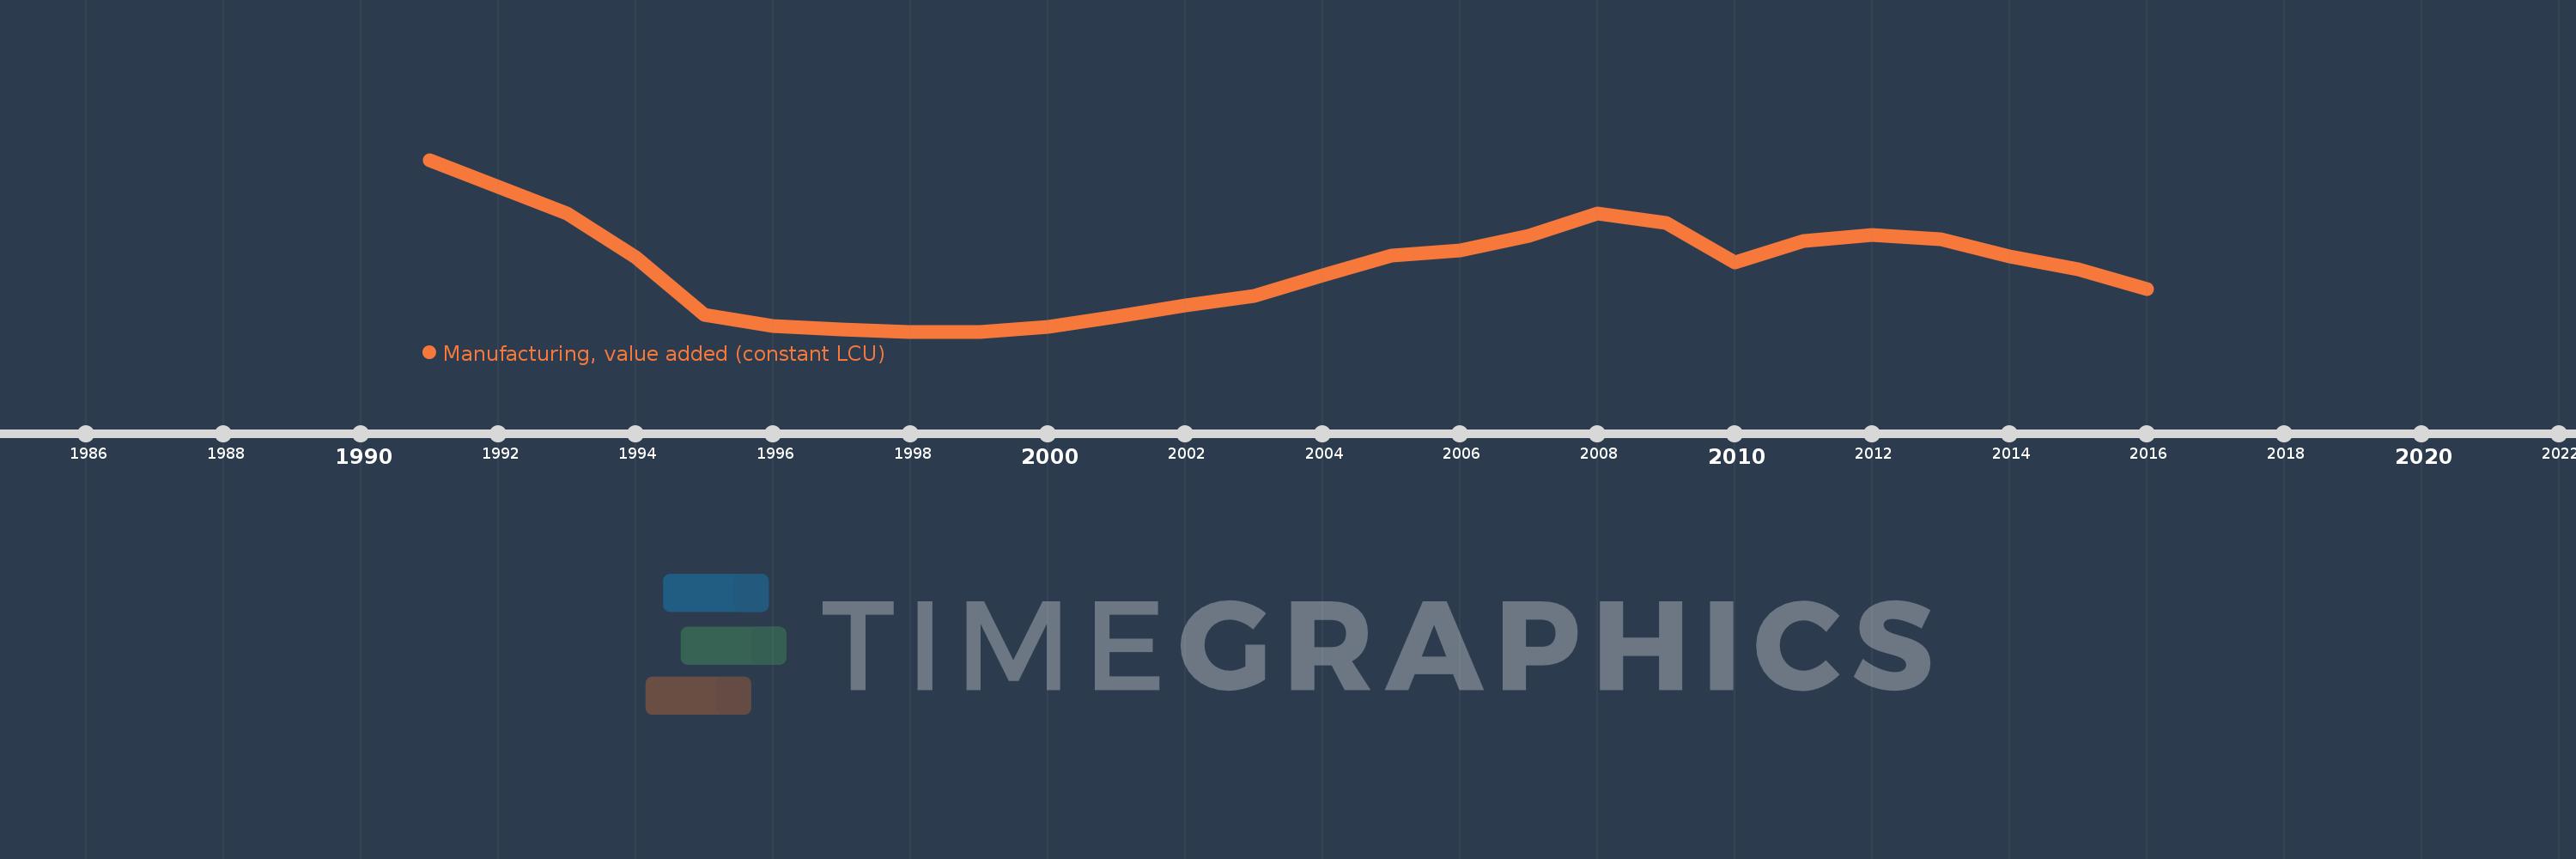
Manufacturing, value added (constant LCU)
2016,2015,2014,2013,2012,2011,2010,2009,2008,2007,2006,2005,2004,2003,2002,2001,2000,1999,1998,1997,1996,1995,1994,1993,1992,1991
Estas estadísticas en otros países:
AfghanistanAlbaniaAlgeriaAntigua and BarbudaArgentinaArmeniaAustraliaAustriaAzerbaijanBahamas, TheBahrainBangladeshBelarusBelgiumBelizeBeninBermudaBhutanBoliviaBosnia and HerzegovinaBotswanaBrazilBrunei DarussalamBurkina FasoBurundiCabo VerdeCambodiaCameroonCanadaCayman IslandsCentral African RepublicChadChileColombiaComorosCongo, Dem. Rep.Congo, Rep.Costa RicaCote d'IvoireCroatiaCubaCyprusCzech RepublicDenmarkDjiboutiDominicaDominican RepublicEcuadorEgypt, Arab Rep.El SalvadorEquatorial GuineaEritreaEstoniaEthiopiaFijiFinlandFranceGabonGambia, TheGeorgiaGermanyGhanaGreeceGrenadaGuatemalaGuineaGuyanaHaitiHondurasHong Kong SAR, ChinaHungaryIcelandIndiaIndonesiaIran, Islamic Rep.IraqIrelandItalyJamaicaJapanJordanKazakhstanKenyaKiribatiKorea, Rep.KosovoKuwaitKyrgyz RepublicLao PDRLatviaLebanonLesothoLiberiaLibyaLithuaniaLuxembourgMacedonia, FYRMadagascarMalawiMalaysiaMaldivesMarshall IslandsMauritaniaMauritiusMexicoMicronesia, Fed. Sts.MoldovaMongoliaMontenegroMoroccoMozambiqueMyanmarNamibiaNepalNetherlandsNew ZealandNicaraguaNigerNigeriaNorwayOmanPakistanPalauPanamaPapua New GuineaParaguayPeruPhilippinesPolandPortugalPuerto RicoQatarRomaniaRussian FederationRwandaSamoaSao Tome and PrincipeSaudi ArabiaSenegalSerbiaSeychellesSierra LeoneSingaporeSlovak RepublicSloveniaSolomon IslandsSomaliaSouth AfricaSpainSri LankaSt. Kitts and NevisSt. LuciaSt. Vincent and the GrenadinesSudanSurinameSwazilandSwedenSwitzerlandSyrian Arab RepublicTajikistanTanzaniaThailandTimor-LesteTogoTongaTrinidad and TobagoTunisiaTurkeyTuvaluUgandaUkraineUnited Arab EmiratesUnited KingdomUnited StatesUruguayUzbekistanVanuatuVenezuela, RBVietnamWest Bank and GazaZambiaZimbabwe línea de tiempo (timeline):
En esta escala de tiempo se presenta un gráfico de 1991 y 2016 de Ukraine. Los datos de 1990 están ausentes. El número de observaciones reales por fecha: 26.
Fuente (nombre):
Indicadores del desarrollo mundial
Fuente (organización):
World Bank national accounts data, and OECD National Accounts data files.
Categorías:
Economy & Growth
Se ha actualizado:
23 abr 2017 año
Los indicadores de los cambios de valor en los últimos años
Mínimo:
66.584 bn
1 ene 1998 año
Máximo:
210.524 bn
1 ene 1991 año
A la fecha de observación
Valor
Cambio absoluto
El cambio con respecto al valor anterior
1 ene 1991 año
210.524 bn
+210.524 bn
0.0%
1 ene 1992 año
187.727 bn
-22.797 bn
-10.83%
1 ene 1993 año
165.486 bn
-22.241 bn
-11.85%
1 ene 1994 año
128.876 bn
-36.609 bn
-22.12%
1 ene 1995 año
80.526 bn
-48.35 bn
-37.52%
1 ene 1996 año
71.507 bn
-9.019 bn
-11.2%
1 ene 1997 año
68.629 bn
-2.878 bn
-4.02%
1 ene 1998 año
66.584 bn
-2.045 bn
-2.98%
1 ene 1999 año
66.584 bn
0.0
0.0%
1 ene 2000 año
70.246 bn
+3.662 bn
5.5%
1 ene 2001 año
79.238 bn
+8.992 bn
12.8%
1 ene 2002 año
88.524 bn
+9.287 bn
11.72%
1 ene 2003 año
96.403 bn
+7.879 bn
8.9%
1 ene 2004 año
113.948 bn
+17.545 bn
18.2%
1 ene 2005 año
130.585 bn
+16.636 bn
14.6%
1 ene 2006 año
134.502 bn
+3.918 bn
3.0%
1 ene 2007 año
146.877 bn
+12.374 bn
9.2%
1 ene 2008 año
165.677 bn
+18.8 bn
12.8%
1 ene 2009 año
157.559 bn
-8.118 bn
-4.9%
1 ene 2010 año
124.629 bn
-32.93 bn
-20.9%
1 ene 2011 año
142.7 bn
+18.071 bn
14.5%
1 ene 2012 año
147.393 bn
+4.693 bn
3.29%
1 ene 2013 año
144.043 bn
-3.35 bn
-2.27%
1 ene 2014 año
129.764 bn
-14.279 bn
-9.91%
1 ene 2015 año
118.57 bn
-11.194 bn
-8.63%
1 ene 2016 año
102.354 bn
-16.216 bn
-13.68%
Ranking de los países por los datos estadísticos actuales


Comentarios: