29
/es/
es
AIzaSyAYiBZKx7MnpbEhh9jyipgxe19OcubqV5w
April 1, 2024
93333
Bulgaria
BGR
true
2
1
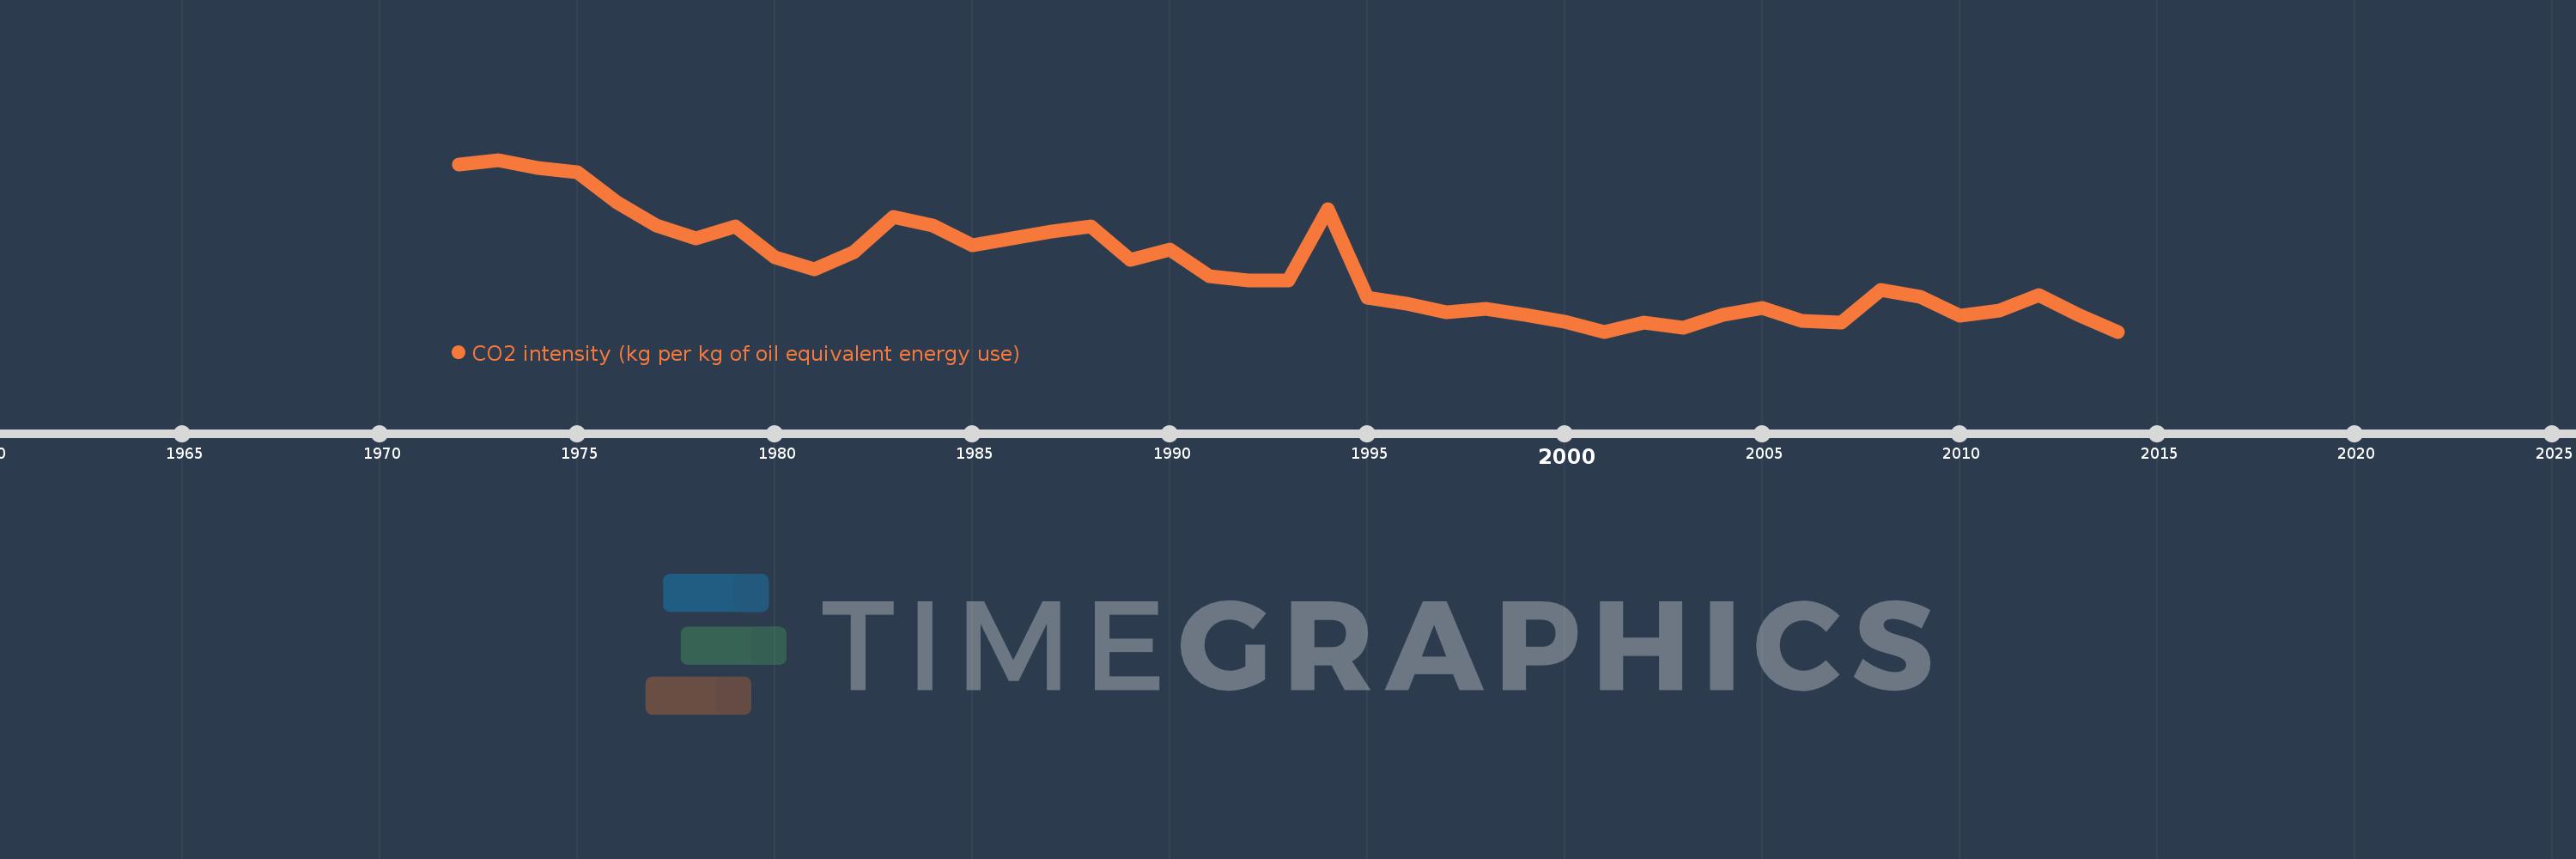
CO2 intensity (kg per kg of oil equivalent energy use)
2014,2013,2012,2011,2010,2009,2008,2007,2006,2005,2004,2003,2002,2001,2000,1999,1998,1997,1996,1995,1994,1993,1992,1991,1990,1989,1988,1987,1986,1985,1984,1983,1982,1981,1980,1979,1978,1977,1976,1975,1974,1973,1972
Estas estadísticas en otros países:
AlbaniaAlgeriaAngolaAntigua and BarbudaArab WorldArgentinaArmeniaAustraliaAustriaAzerbaijanBahamas, TheBahrainBangladeshBarbadosBelarusBelgiumBelizeBeninBhutanBoliviaBosnia and HerzegovinaBotswanaBrazilBrunei DarussalamBulgariaCabo VerdeCambodiaCameroonCanadaCaribbean small statesCentral Europe and the BalticsChileChinaColombiaComorosCongo, Dem. Rep.Congo, Rep.Costa RicaCote d'IvoireCroatiaCubaCuracaoCyprusCzech RepublicDenmarkDjiboutiDominicaDominican RepublicEarly-demographic dividendEast Asia & PacificEast Asia & Pacific (excluding high income)East Asia & Pacific (IDA & IBRD countries)EcuadorEgypt, Arab Rep.El SalvadorEquatorial GuineaEritreaEstoniaEthiopiaEuro areaEurope & Central AsiaEurope & Central Asia (excluding high income)Europe & Central Asia (IDA & IBRD countries)European UnionFijiFinlandFragile and conflict affected situationsFranceGabonGambia, TheGeorgiaGermanyGhanaGibraltarGreeceGrenadaGuatemalaGuinea-BissauGuyanaHaitiHeavily indebted poor countries (HIPC)High incomeHondurasHong Kong SAR, ChinaHungaryIBRD onlyIcelandIDA & IBRD totalIDA blendIDA onlyIDA totalIndiaIndonesiaIran, Islamic Rep.IraqIrelandIsraelItalyJamaicaJapanJordanKazakhstanKenyaKiribatiKorea, Dem. People’s Rep.Korea, Rep.KuwaitKyrgyz RepublicLate-demographic dividendLatin America & Caribbean Latin America & Caribbean (excluding high income)Latin America & the Caribbean (IDA & IBRD countries)LatviaLeast developed countries: UN classificationLebanonLesothoLibyaLithuaniaLow & middle incomeLow incomeLower middle incomeLuxembourgMacedonia, FYRMalaysiaMaldivesMaltaMarshall IslandsMauritiusMexicoMiddle East & North AfricaMiddle East & North Africa (excluding high income)Middle East & North Africa (IDA & IBRD countries)Middle incomeMoldovaMongoliaMontenegroMoroccoMozambiqueMyanmarNamibiaNepalNetherlandsNew ZealandNicaraguaNigerNigeriaNorth AmericaNorwayOECD membersOmanOther small statesPacific island small statesPakistanPalauPanamaParaguayPeruPhilippinesPolandPortugalPost-demographic dividendPre-demographic dividendQatarRomaniaRussian FederationSamoaSao Tome and PrincipeSaudi ArabiaSenegalSerbiaSeychellesSingaporeSlovak RepublicSloveniaSmall statesSolomon IslandsSouth AfricaSouth AsiaSouth Asia (IDA & IBRD)South SudanSpainSri LankaSt. Kitts and NevisSt. LuciaSt. Vincent and the GrenadinesSub-Saharan Africa Sub-Saharan Africa (excluding high income)Sub-Saharan Africa (IDA & IBRD countries)SudanSurinameSwazilandSwedenSwitzerlandSyrian Arab RepublicTajikistanTanzaniaThailandTimor-LesteTogoTongaTrinidad and TobagoTunisiaTurkeyTurkmenistanUkraineUnited Arab EmiratesUnited KingdomUnited StatesUpper middle incomeUruguayUzbekistanVanuatuVenezuela, RBVietnamWorldYemen, Rep.ZambiaZimbabwe línea de tiempo (timeline):
En esta escala de tiempo se presenta un gráfico de 1972 y 2014 de Bulgaria. Los datos de 1971 están ausentes. El número de observaciones reales por fecha: 43.
Fuente (nombre):
Indicadores del desarrollo mundial
Fuente (organización):
Carbon Dioxide Information Analysis Center, Environmental Sciences Division, Oak Ridge National Laboratory, Tennessee, United States.
Categorías:
Climate Change, Environment
Se ha actualizado:
23 abr 2017 año
Los indicadores de los cambios de valor en los últimos años
Mínimo:
2.34
1 ene 2001 año
Máximo:
3.41
1 ene 1973 año
A la fecha de observación
Valor
Cambio absoluto
El cambio con respecto al valor anterior
1 ene 1972 año
3.38
+3.38
0.0%
1 ene 1973 año
3.41
+0.03
0.89%
1 ene 1974 año
3.357
-0.053
-1.55%
1 ene 1975 año
3.333
-0.024
-0.7%
1 ene 1976 año
3.143
-0.19
-5.71%
1 ene 1977 año
3.003
-0.141
-4.47%
1 ene 1978 año
2.921
-0.082
-2.72%
1 ene 1979 año
2.995
+0.074
2.53%
1 ene 1980 año
2.802
-0.192
-6.43%
1 ene 1981 año
2.729
-0.073
-2.59%
1 ene 1982 año
2.837
+0.107
3.93%
1 ene 1983 año
3.054
+0.218
7.67%
1 ene 1984 año
2.999
-0.055
-1.8%
1 ene 1985 año
2.878
-0.121
-4.03%
1 ene 1986 año
2.922
+0.044
1.52%
1 ene 1987 año
2.961
+0.039
1.32%
1 ene 1988 año
2.994
+0.034
1.14%
1 ene 1989 año
2.786
-0.208
-6.96%
1 ene 1990 año
2.851
+0.065
2.34%
1 ene 1991 año
2.684
-0.167
-5.86%
1 ene 1992 año
2.657
-0.028
-1.03%
1 ene 1993 año
2.661
+0.005
0.17%
1 ene 1994 año
3.102
+0.441
16.57%
1 ene 1995 año
2.554
-0.548
-17.67%
1 ene 1996 año
2.512
-0.042
-1.64%
1 ene 1997 año
2.463
-0.049
-1.95%
1 ene 1998 año
2.48
+0.017
0.68%
1 ene 1999 año
2.446
-0.034
-1.36%
1 ene 2000 año
2.401
-0.045
-1.83%
1 ene 2001 año
2.34
-0.062
-2.58%
1 ene 2002 año
2.396
+0.056
2.39%
1 ene 2003 año
2.362
-0.033
-1.39%
1 ene 2004 año
2.443
+0.081
3.42%
1 ene 2005 año
2.485
+0.042
1.71%
1 ene 2006 año
2.408
-0.077
-3.09%
1 ene 2007 año
2.395
-0.013
-0.56%
1 ene 2008 año
2.598
+0.203
8.47%
1 ene 2009 año
2.557
-0.041
-1.58%
1 ene 2010 año
2.437
-0.12
-4.67%
1 ene 2011 año
2.469
+0.032
1.3%
1 ene 2012 año
2.566
+0.097
3.95%
1 ene 2013 año
2.444
-0.122
-4.77%
1 ene 2014 año
2.34
-0.104
-4.26%
Ranking de los países por los datos estadísticos actuales


Comentarios: