29
/es/
es
AIzaSyAYiBZKx7MnpbEhh9jyipgxe19OcubqV5w
April 1, 2024
40556
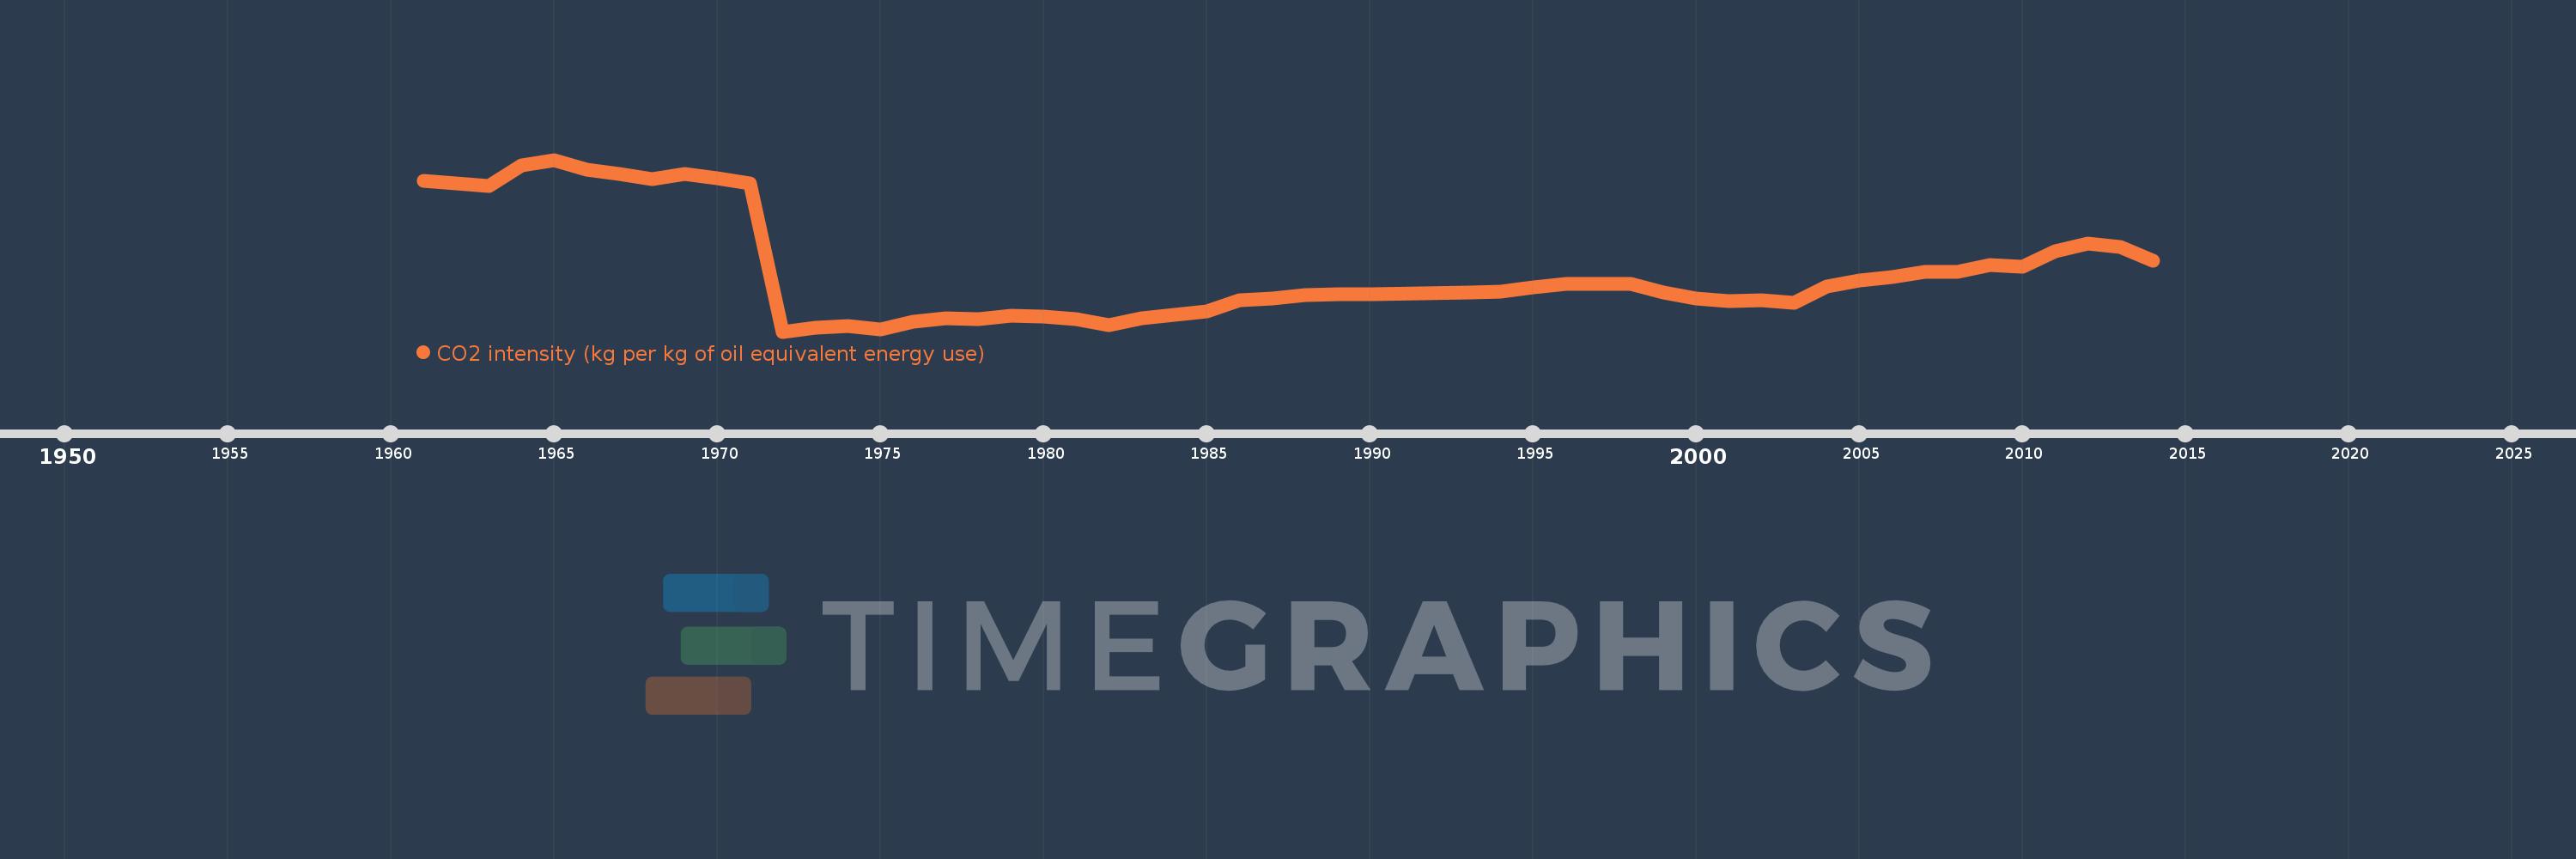
Late-demographic dividend
LTE
false
2
1
CO2 intensity (kg per kg of oil equivalent energy use)
2014,2013,2012,2011,2010,2009,2008,2007,2006,2005,2004,2003,2002,2001,2000,1999,1998,1997,1996,1995,1994,1993,1990,1989,1988,1987,1986,1985,1984,1983,1982,1981,1980,1979,1978,1977,1976,1975,1974,1973,1972,1971,1970,1969,1968,1967,1966,1965,1964,1963,1962,1961
Estas estadísticas en otros países:
AlbaniaAlgeriaAngolaAntigua and BarbudaArab WorldArgentinaArmeniaAustraliaAustriaAzerbaijanBahamas, TheBahrainBangladeshBarbadosBelarusBelgiumBelizeBeninBhutanBoliviaBosnia and HerzegovinaBotswanaBrazilBrunei DarussalamBulgariaCabo VerdeCambodiaCameroonCanadaCaribbean small statesCentral Europe and the BalticsChileChinaColombiaComorosCongo, Dem. Rep.Congo, Rep.Costa RicaCote d'IvoireCroatiaCubaCuracaoCyprusCzech RepublicDenmarkDjiboutiDominicaDominican RepublicEarly-demographic dividendEast Asia & PacificEast Asia & Pacific (excluding high income)East Asia & Pacific (IDA & IBRD countries)EcuadorEgypt, Arab Rep.El SalvadorEquatorial GuineaEritreaEstoniaEthiopiaEuro areaEurope & Central AsiaEurope & Central Asia (excluding high income)Europe & Central Asia (IDA & IBRD countries)European UnionFijiFinlandFragile and conflict affected situationsFranceGabonGambia, TheGeorgiaGermanyGhanaGibraltarGreeceGrenadaGuatemalaGuinea-BissauGuyanaHaitiHeavily indebted poor countries (HIPC)High incomeHondurasHong Kong SAR, ChinaHungaryIBRD onlyIcelandIDA & IBRD totalIDA blendIDA onlyIDA totalIndiaIndonesiaIran, Islamic Rep.IraqIrelandIsraelItalyJamaicaJapanJordanKazakhstanKenyaKiribatiKorea, Dem. People’s Rep.Korea, Rep.KuwaitKyrgyz RepublicLate-demographic dividendLatin America & Caribbean Latin America & Caribbean (excluding high income)Latin America & the Caribbean (IDA & IBRD countries)LatviaLeast developed countries: UN classificationLebanonLesothoLibyaLithuaniaLow & middle incomeLow incomeLower middle incomeLuxembourgMacedonia, FYRMalaysiaMaldivesMaltaMarshall IslandsMauritiusMexicoMiddle East & North AfricaMiddle East & North Africa (excluding high income)Middle East & North Africa (IDA & IBRD countries)Middle incomeMoldovaMongoliaMontenegroMoroccoMozambiqueMyanmarNamibiaNepalNetherlandsNew ZealandNicaraguaNigerNigeriaNorth AmericaNorwayOECD membersOmanOther small statesPacific island small statesPakistanPalauPanamaParaguayPeruPhilippinesPolandPortugalPost-demographic dividendPre-demographic dividendQatarRomaniaRussian FederationSamoaSao Tome and PrincipeSaudi ArabiaSenegalSerbiaSeychellesSingaporeSlovak RepublicSloveniaSmall statesSolomon IslandsSouth AfricaSouth AsiaSouth Asia (IDA & IBRD)South SudanSpainSri LankaSt. Kitts and NevisSt. LuciaSt. Vincent and the GrenadinesSub-Saharan Africa Sub-Saharan Africa (excluding high income)Sub-Saharan Africa (IDA & IBRD countries)SudanSurinameSwazilandSwedenSwitzerlandSyrian Arab RepublicTajikistanTanzaniaThailandTimor-LesteTogoTongaTrinidad and TobagoTunisiaTurkeyTurkmenistanUkraineUnited Arab EmiratesUnited KingdomUnited StatesUpper middle incomeUruguayUzbekistanVanuatuVenezuela, RBVietnamWorldYemen, Rep.ZambiaZimbabwe línea de tiempo (timeline):
En esta escala de tiempo se presenta un gráfico de 1961 y 2014 de Late-demographic dividend. Los datos de 1960 están ausentes. El número de observaciones reales por fecha: 52.
Fuente (nombre):
Indicadores del desarrollo mundial
Fuente (organización):
Carbon Dioxide Information Analysis Center, Environmental Sciences Division, Oak Ridge National Laboratory, Tennessee, United States.
Categorías:
Climate Change, Environment
Se ha actualizado:
23 abr 2017 año
Los indicadores de los cambios de valor en los últimos años
Mínimo:
2.46
1 ene 1972 año
Máximo:
3.79
1 ene 1965 año
A la fecha de observación
Valor
Cambio absoluto
El cambio con respecto al valor anterior
1 ene 1961 año
3.63
+3.63
0.0%
1 ene 1962 año
3.608
-0.022
-0.6%
1 ene 1963 año
3.585
-0.023
-0.65%
1 ene 1964 año
3.745
+0.16
4.46%
1 ene 1965 año
3.79
+0.046
1.22%
1 ene 1966 año
3.712
-0.078
-2.06%
1 ene 1967 año
3.677
-0.036
-0.96%
1 ene 1968 año
3.638
-0.039
-1.06%
1 ene 1969 año
3.683
+0.045
1.24%
1 ene 1970 año
3.65
-0.033
-0.89%
1 ene 1971 año
3.608
-0.042
-1.14%
1 ene 1972 año
2.46
-1.148
-31.82%
1 ene 1973 año
2.491
+0.031
1.25%
1 ene 1974 año
2.5
+0.01
0.38%
1 ene 1975 año
2.476
-0.025
-0.98%
1 ene 1976 año
2.536
+0.06
2.44%
1 ene 1977 año
2.563
+0.027
1.08%
1 ene 1978 año
2.555
-0.009
-0.34%
1 ene 1979 año
2.586
+0.031
1.23%
1 ene 1980 año
2.578
-0.008
-0.32%
1 ene 1981 año
2.555
-0.024
-0.91%
1 ene 1982 año
2.51
-0.045
-1.75%
1 ene 1983 año
2.561
+0.052
2.06%
1 ene 1984 año
2.588
+0.027
1.05%
1 ene 1985 año
2.617
+0.029
1.12%
1 ene 1986 año
2.705
+0.087
3.34%
1 ene 1987 año
2.719
+0.014
0.53%
1 ene 1988 año
2.74
+0.021
0.79%
1 ene 1989 año
2.752
+0.012
0.43%
1 ene 1990 año
2.746
-0.006
-0.22%
1 ene 1993 año
2.765
+0.019
0.68%
1 ene 1994 año
2.772
+0.007
0.27%
1 ene 1995 año
2.804
+0.032
1.16%
1 ene 1996 año
2.829
+0.025
0.89%
1 ene 1997 año
2.83
+0.001
0.03%
1 ene 1998 año
2.826
-0.005
-0.16%
1 ene 1999 año
2.763
-0.062
-2.2%
1 ene 2000 año
2.715
-0.048
-1.73%
1 ene 2001 año
2.698
-0.018
-0.65%
1 ene 2002 año
2.702
+0.005
0.17%
1 ene 2003 año
2.685
-0.017
-0.64%
1 ene 2004 año
2.812
+0.127
4.75%
1 ene 2005 año
2.854
+0.041
1.48%
1 ene 2006 año
2.883
+0.029
1.02%
1 ene 2007 año
2.921
+0.038
1.33%
1 ene 2008 año
2.925
+0.003
0.12%
1 ene 2009 año
2.976
+0.051
1.74%
1 ene 2010 año
2.964
-0.012
-0.41%
1 ene 2011 año
3.082
+0.119
4.0%
1 ene 2012 año
3.143
+0.061
1.98%
1 ene 2013 año
3.114
-0.03
-0.94%
1 ene 2014 año
3.009
-0.105
-3.37%
Ranking de los países por los datos estadísticos actuales


Comentarios: