29
/es/
es
AIzaSyAYiBZKx7MnpbEhh9jyipgxe19OcubqV5w
April 1, 2024
267751
Tunisia
TUN
true
2
1
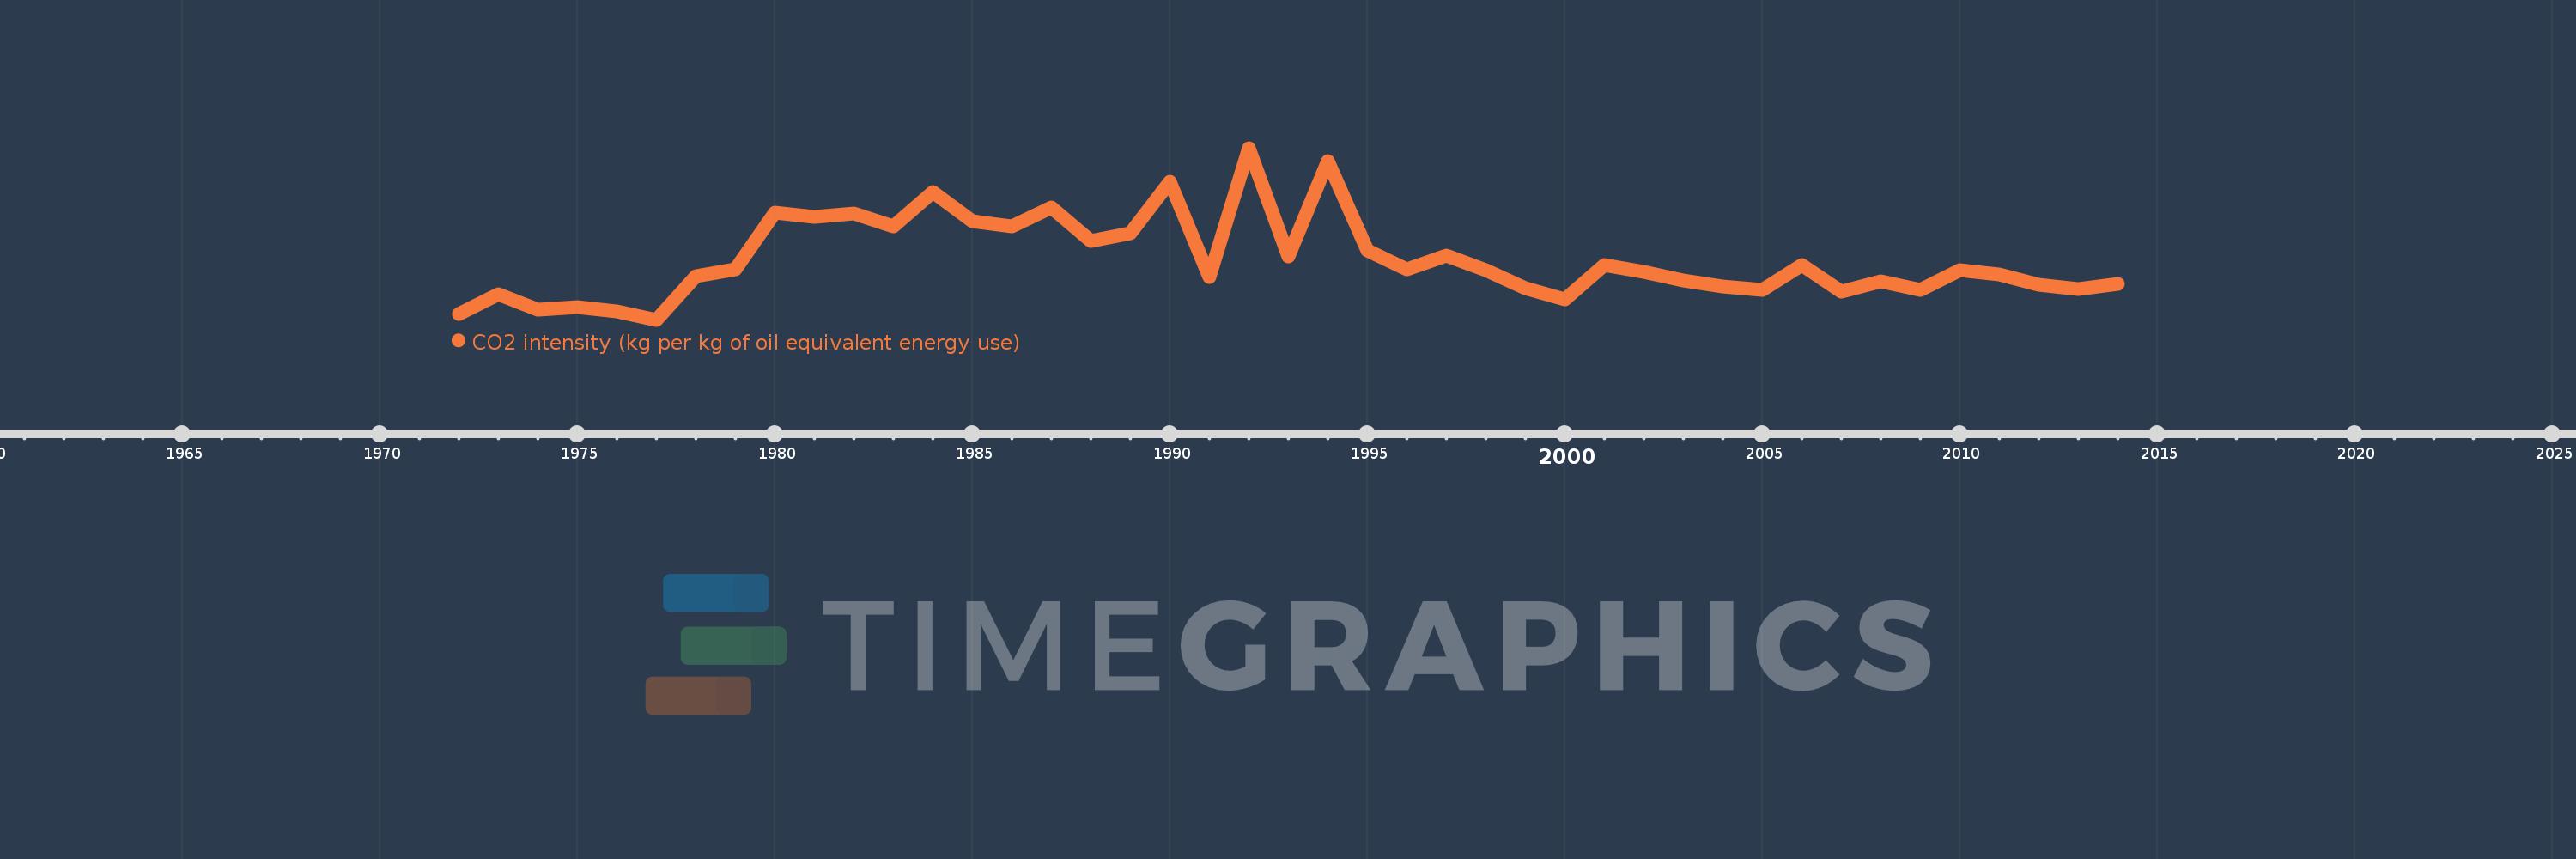
CO2 intensity (kg per kg of oil equivalent energy use)
2014,2013,2012,2011,2010,2009,2008,2007,2006,2005,2004,2003,2002,2001,2000,1999,1998,1997,1996,1995,1994,1993,1992,1991,1990,1989,1988,1987,1986,1985,1984,1983,1982,1981,1980,1979,1978,1977,1976,1975,1974,1973,1972
Estas estadísticas en otros países:
AlbaniaAlgeriaAngolaAntigua and BarbudaArab WorldArgentinaArmeniaAustraliaAustriaAzerbaijanBahamas, TheBahrainBangladeshBarbadosBelarusBelgiumBelizeBeninBhutanBoliviaBosnia and HerzegovinaBotswanaBrazilBrunei DarussalamBulgariaCabo VerdeCambodiaCameroonCanadaCaribbean small statesCentral Europe and the BalticsChileChinaColombiaComorosCongo, Dem. Rep.Congo, Rep.Costa RicaCote d'IvoireCroatiaCubaCuracaoCyprusCzech RepublicDenmarkDjiboutiDominicaDominican RepublicEarly-demographic dividendEast Asia & PacificEast Asia & Pacific (excluding high income)East Asia & Pacific (IDA & IBRD countries)EcuadorEgypt, Arab Rep.El SalvadorEquatorial GuineaEritreaEstoniaEthiopiaEuro areaEurope & Central AsiaEurope & Central Asia (excluding high income)Europe & Central Asia (IDA & IBRD countries)European UnionFijiFinlandFragile and conflict affected situationsFranceGabonGambia, TheGeorgiaGermanyGhanaGibraltarGreeceGrenadaGuatemalaGuinea-BissauGuyanaHaitiHeavily indebted poor countries (HIPC)High incomeHondurasHong Kong SAR, ChinaHungaryIBRD onlyIcelandIDA & IBRD totalIDA blendIDA onlyIDA totalIndiaIndonesiaIran, Islamic Rep.IraqIrelandIsraelItalyJamaicaJapanJordanKazakhstanKenyaKiribatiKorea, Dem. People’s Rep.Korea, Rep.KuwaitKyrgyz RepublicLate-demographic dividendLatin America & Caribbean Latin America & Caribbean (excluding high income)Latin America & the Caribbean (IDA & IBRD countries)LatviaLeast developed countries: UN classificationLebanonLesothoLibyaLithuaniaLow & middle incomeLow incomeLower middle incomeLuxembourgMacedonia, FYRMalaysiaMaldivesMaltaMarshall IslandsMauritiusMexicoMiddle East & North AfricaMiddle East & North Africa (excluding high income)Middle East & North Africa (IDA & IBRD countries)Middle incomeMoldovaMongoliaMontenegroMoroccoMozambiqueMyanmarNamibiaNepalNetherlandsNew ZealandNicaraguaNigerNigeriaNorth AmericaNorwayOECD membersOmanOther small statesPacific island small statesPakistanPalauPanamaParaguayPeruPhilippinesPolandPortugalPost-demographic dividendPre-demographic dividendQatarRomaniaRussian FederationSamoaSao Tome and PrincipeSaudi ArabiaSenegalSerbiaSeychellesSingaporeSlovak RepublicSloveniaSmall statesSolomon IslandsSouth AfricaSouth AsiaSouth Asia (IDA & IBRD)South SudanSpainSri LankaSt. Kitts and NevisSt. LuciaSt. Vincent and the GrenadinesSub-Saharan Africa Sub-Saharan Africa (excluding high income)Sub-Saharan Africa (IDA & IBRD countries)SudanSurinameSwazilandSwedenSwitzerlandSyrian Arab RepublicTajikistanTanzaniaThailandTimor-LesteTogoTongaTrinidad and TobagoTunisiaTurkeyTurkmenistanUkraineUnited Arab EmiratesUnited KingdomUnited StatesUpper middle incomeUruguayUzbekistanVanuatuVenezuela, RBVietnamWorldYemen, Rep.ZambiaZimbabwe línea de tiempo (timeline):
En esta escala de tiempo se presenta un gráfico de 1972 y 2014 de Tunisia. Los datos de 1971 están ausentes. El número de observaciones reales por fecha: 43.
Fuente (nombre):
Indicadores del desarrollo mundial
Fuente (organización):
Carbon Dioxide Information Analysis Center, Environmental Sciences Division, Oak Ridge National Laboratory, Tennessee, United States.
Categorías:
Climate Change, Environment
Se ha actualizado:
23 abr 2017 año
Los indicadores de los cambios de valor en los últimos años
Mínimo:
2.523
1 ene 1977 año
Máximo:
3.162
1 ene 1992 año
A la fecha de observación
Valor
Cambio absoluto
El cambio con respecto al valor anterior
1 ene 1972 año
2.545
+2.545
0.0%
1 ene 1973 año
2.619
+0.074
2.9%
1 ene 1974 año
2.561
-0.058
-2.21%
1 ene 1975 año
2.569
+0.009
0.34%
1 ene 1976 año
2.553
-0.016
-0.63%
1 ene 1977 año
2.523
-0.03
-1.18%
1 ene 1978 año
2.685
+0.163
6.44%
1 ene 1979 año
2.711
+0.026
0.96%
1 ene 1980 año
2.923
+0.211
7.8%
1 ene 1981 año
2.905
-0.017
-0.59%
1 ene 1982 año
2.917
+0.012
0.4%
1 ene 1983 año
2.871
-0.045
-1.56%
1 ene 1984 año
2.998
+0.126
4.4%
1 ene 1985 año
2.89
-0.108
-3.6%
1 ene 1986 año
2.869
-0.021
-0.73%
1 ene 1987 año
2.939
+0.071
2.46%
1 ene 1988 año
2.817
-0.122
-4.15%
1 ene 1989 año
2.845
+0.028
0.99%
1 ene 1990 año
3.035
+0.19
6.68%
1 ene 1991 año
2.682
-0.353
-11.64%
1 ene 1992 año
3.162
+0.48
17.89%
1 ene 1993 año
2.758
-0.404
-12.78%
1 ene 1994 año
3.112
+0.354
12.84%
1 ene 1995 año
2.781
-0.331
-10.62%
1 ene 1996 año
2.711
-0.07
-2.53%
1 ene 1997 año
2.762
+0.051
1.89%
1 ene 1998 año
2.708
-0.054
-1.96%
1 ene 1999 año
2.639
-0.069
-2.53%
1 ene 2000 año
2.6
-0.039
-1.48%
1 ene 2001 año
2.727
+0.127
4.87%
1 ene 2002 año
2.7
-0.027
-1.0%
1 ene 2003 año
2.67
-0.03
-1.1%
1 ene 2004 año
2.647
-0.023
-0.87%
1 ene 2005 año
2.635
-0.012
-0.44%
1 ene 2006 año
2.726
+0.091
3.44%
1 ene 2007 año
2.627
-0.098
-3.61%
1 ene 2008 año
2.667
+0.04
1.53%
1 ene 2009 año
2.633
-0.034
-1.27%
1 ene 2010 año
2.707
+0.073
2.79%
1 ene 2011 año
2.69
-0.017
-0.61%
1 ene 2012 año
2.652
-0.039
-1.44%
1 ene 2013 año
2.636
-0.016
-0.59%
1 ene 2014 año
2.657
+0.021
0.8%
Ranking de los países por los datos estadísticos actuales


Comentarios: