29
/es/
es
AIzaSyAYiBZKx7MnpbEhh9jyipgxe19OcubqV5w
April 1, 2024
34101
Fragile and conflict affected situations
FCS
false
2
1
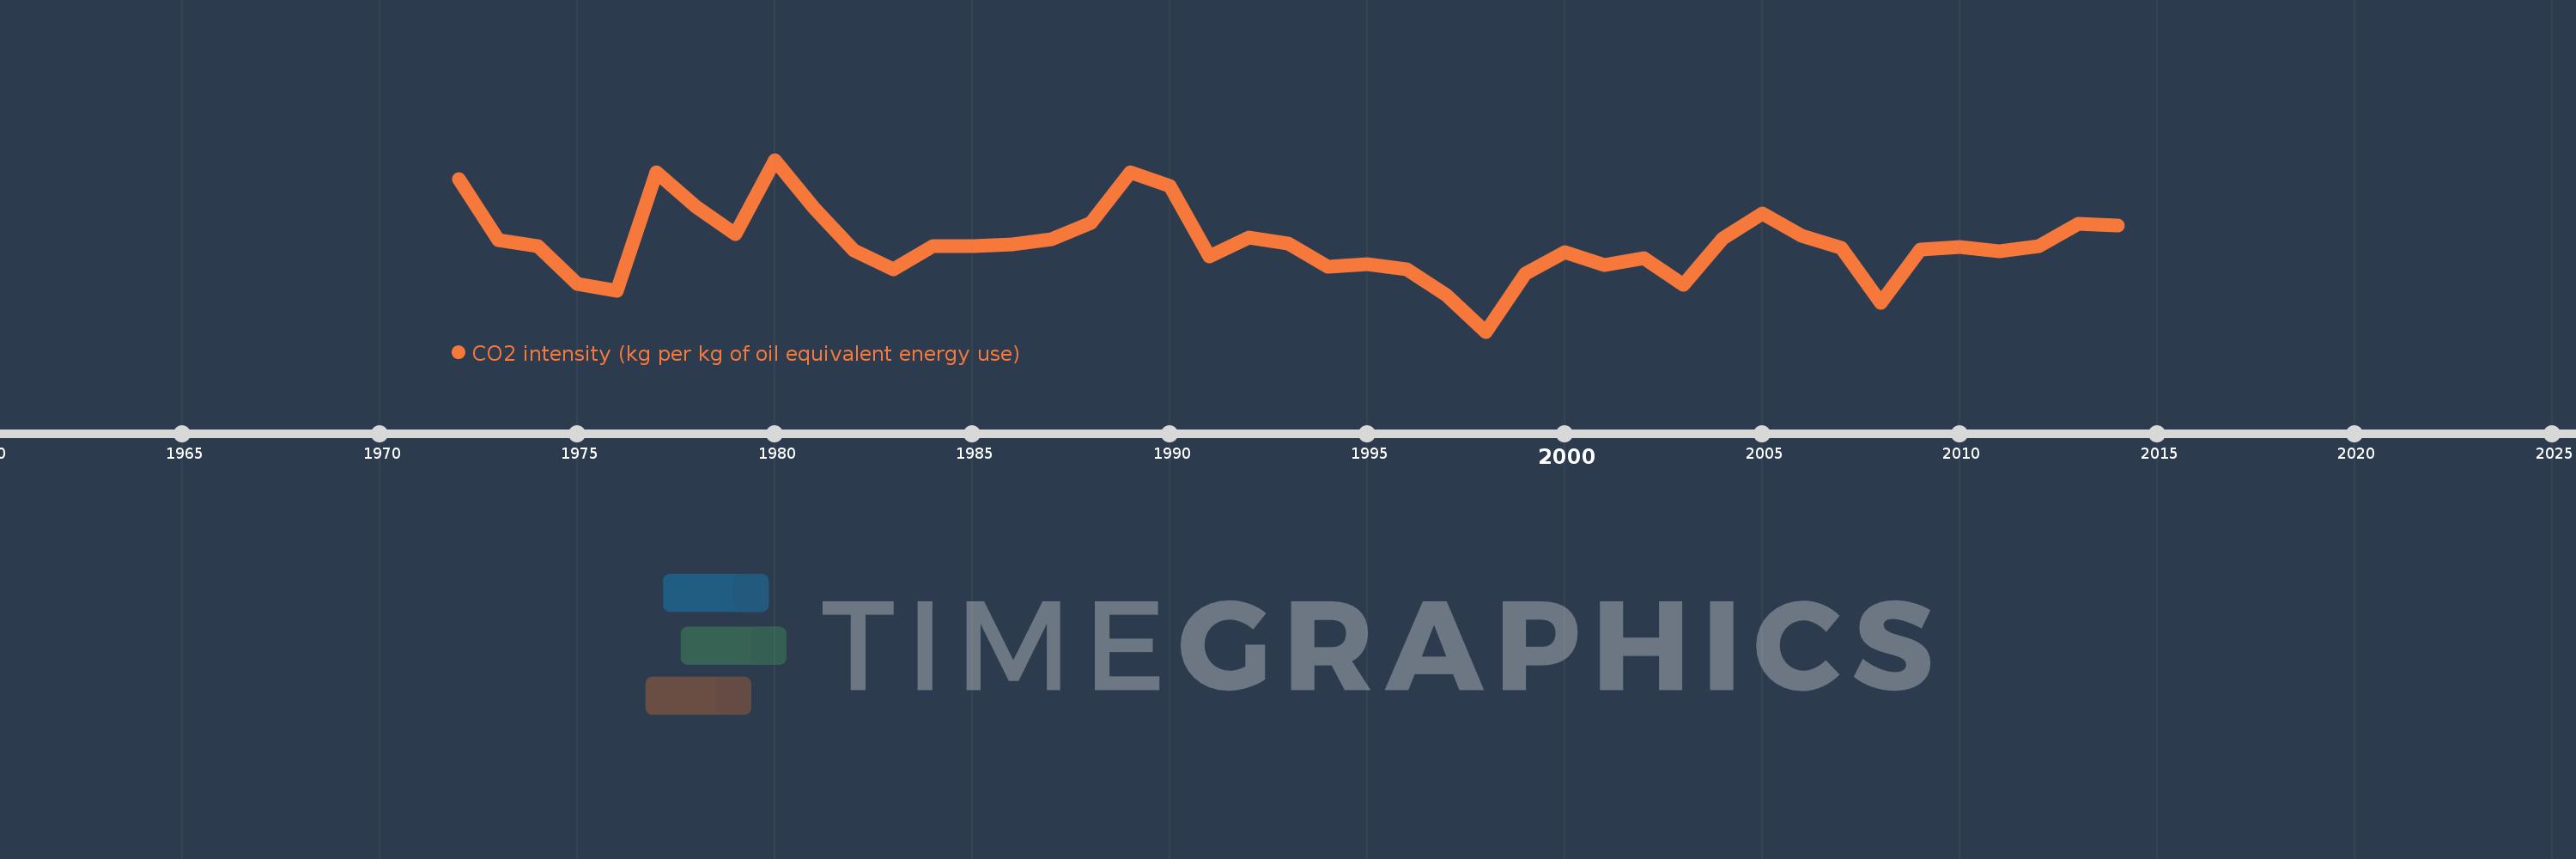
CO2 intensity (kg per kg of oil equivalent energy use)
2014,2013,2012,2011,2010,2009,2008,2007,2006,2005,2004,2003,2002,2001,2000,1999,1998,1997,1996,1995,1994,1993,1992,1991,1990,1989,1988,1987,1986,1985,1984,1983,1982,1981,1980,1979,1978,1977,1976,1975,1974,1973,1972
Estas estadísticas en otros países:
AlbaniaAlgeriaAngolaAntigua and BarbudaArab WorldArgentinaArmeniaAustraliaAustriaAzerbaijanBahamas, TheBahrainBangladeshBarbadosBelarusBelgiumBelizeBeninBhutanBoliviaBosnia and HerzegovinaBotswanaBrazilBrunei DarussalamBulgariaCabo VerdeCambodiaCameroonCanadaCaribbean small statesCentral Europe and the BalticsChileChinaColombiaComorosCongo, Dem. Rep.Congo, Rep.Costa RicaCote d'IvoireCroatiaCubaCuracaoCyprusCzech RepublicDenmarkDjiboutiDominicaDominican RepublicEarly-demographic dividendEast Asia & PacificEast Asia & Pacific (excluding high income)East Asia & Pacific (IDA & IBRD countries)EcuadorEgypt, Arab Rep.El SalvadorEquatorial GuineaEritreaEstoniaEthiopiaEuro areaEurope & Central AsiaEurope & Central Asia (excluding high income)Europe & Central Asia (IDA & IBRD countries)European UnionFijiFinlandFragile and conflict affected situationsFranceGabonGambia, TheGeorgiaGermanyGhanaGibraltarGreeceGrenadaGuatemalaGuinea-BissauGuyanaHaitiHeavily indebted poor countries (HIPC)High incomeHondurasHong Kong SAR, ChinaHungaryIBRD onlyIcelandIDA & IBRD totalIDA blendIDA onlyIDA totalIndiaIndonesiaIran, Islamic Rep.IraqIrelandIsraelItalyJamaicaJapanJordanKazakhstanKenyaKiribatiKorea, Dem. People’s Rep.Korea, Rep.KuwaitKyrgyz RepublicLate-demographic dividendLatin America & Caribbean Latin America & Caribbean (excluding high income)Latin America & the Caribbean (IDA & IBRD countries)LatviaLeast developed countries: UN classificationLebanonLesothoLibyaLithuaniaLow & middle incomeLow incomeLower middle incomeLuxembourgMacedonia, FYRMalaysiaMaldivesMaltaMarshall IslandsMauritiusMexicoMiddle East & North AfricaMiddle East & North Africa (excluding high income)Middle East & North Africa (IDA & IBRD countries)Middle incomeMoldovaMongoliaMontenegroMoroccoMozambiqueMyanmarNamibiaNepalNetherlandsNew ZealandNicaraguaNigerNigeriaNorth AmericaNorwayOECD membersOmanOther small statesPacific island small statesPakistanPalauPanamaParaguayPeruPhilippinesPolandPortugalPost-demographic dividendPre-demographic dividendQatarRomaniaRussian FederationSamoaSao Tome and PrincipeSaudi ArabiaSenegalSerbiaSeychellesSingaporeSlovak RepublicSloveniaSmall statesSolomon IslandsSouth AfricaSouth AsiaSouth Asia (IDA & IBRD)South SudanSpainSri LankaSt. Kitts and NevisSt. LuciaSt. Vincent and the GrenadinesSub-Saharan Africa Sub-Saharan Africa (excluding high income)Sub-Saharan Africa (IDA & IBRD countries)SudanSurinameSwazilandSwedenSwitzerlandSyrian Arab RepublicTajikistanTanzaniaThailandTimor-LesteTogoTongaTrinidad and TobagoTunisiaTurkeyTurkmenistanUkraineUnited Arab EmiratesUnited KingdomUnited StatesUpper middle incomeUruguayUzbekistanVanuatuVenezuela, RBVietnamWorldYemen, Rep.ZambiaZimbabwe línea de tiempo (timeline):
En esta escala de tiempo se presenta un gráfico de 1972 y 2014 de Fragile and conflict affected situations. Los datos de 1971 están ausentes. El número de observaciones reales por fecha: 43.
Fuente (nombre):
Indicadores del desarrollo mundial
Fuente (organización):
Carbon Dioxide Information Analysis Center, Environmental Sciences Division, Oak Ridge National Laboratory, Tennessee, United States.
Categorías:
Climate Change, Environment
Se ha actualizado:
23 abr 2017 año
Los indicadores de los cambios de valor en los últimos años
Mínimo:
1.639
1 ene 1998 año
Máximo:
2.241
1 ene 1980 año
A la fecha de observación
Valor
Cambio absoluto
El cambio con respecto al valor anterior
1 ene 1972 año
2.174
+2.174
0.0%
1 ene 1973 año
1.959
-0.214
-9.86%
1 ene 1974 año
1.939
-0.02
-1.02%
1 ene 1975 año
1.806
-0.134
-6.89%
1 ene 1976 año
1.781
-0.025
-1.36%
1 ene 1977 año
2.198
+0.416
23.38%
1 ene 1978 año
2.076
-0.122
-5.53%
1 ene 1979 año
1.98
-0.096
-4.63%
1 ene 1980 año
2.241
+0.262
13.21%
1 ene 1981 año
2.07
-0.171
-7.65%
1 ene 1982 año
1.922
-0.147
-7.12%
1 ene 1983 año
1.858
-0.064
-3.34%
1 ene 1984 año
1.94
+0.082
4.4%
1 ene 1985 año
1.937
-0.003
-0.17%
1 ene 1986 año
1.944
+0.007
0.37%
1 ene 1987 año
1.962
+0.018
0.94%
1 ene 1988 año
2.021
+0.059
2.99%
1 ene 1989 año
2.196
+0.175
8.66%
1 ene 1990 año
2.15
-0.046
-2.09%
1 ene 1991 año
1.901
-0.249
-11.57%
1 ene 1992 año
1.97
+0.069
3.61%
1 ene 1993 año
1.947
-0.023
-1.16%
1 ene 1994 año
1.866
-0.081
-4.16%
1 ene 1995 año
1.875
+0.009
0.49%
1 ene 1996 año
1.856
-0.019
-1.01%
1 ene 1997 año
1.766
-0.091
-4.89%
1 ene 1998 año
1.639
-0.127
-7.17%
1 ene 1999 año
1.841
+0.202
12.34%
1 ene 2000 año
1.917
+0.076
4.11%
1 ene 2001 año
1.871
-0.046
-2.39%
1 ene 2002 año
1.895
+0.024
1.29%
1 ene 2003 año
1.804
-0.091
-4.82%
1 ene 2004 año
1.967
+0.163
9.05%
1 ene 2005 año
2.053
+0.086
4.38%
1 ene 2006 año
1.976
-0.077
-3.75%
1 ene 2007 año
1.932
-0.045
-2.26%
1 ene 2008 año
1.741
-0.191
-9.88%
1 ene 2009 año
1.926
+0.186
10.66%
1 ene 2010 año
1.935
+0.009
0.46%
1 ene 2011 año
1.92
-0.016
-0.82%
1 ene 2012 año
1.939
+0.02
1.02%
1 ene 2013 año
2.016
+0.077
3.96%
1 ene 2014 año
2.011
-0.005
-0.26%
Ranking de los países por los datos estadísticos actuales


Comentarios: