29
/es/
es
AIzaSyAYiBZKx7MnpbEhh9jyipgxe19OcubqV5w
April 1, 2024
89794
Botswana
BWA
true
2
1
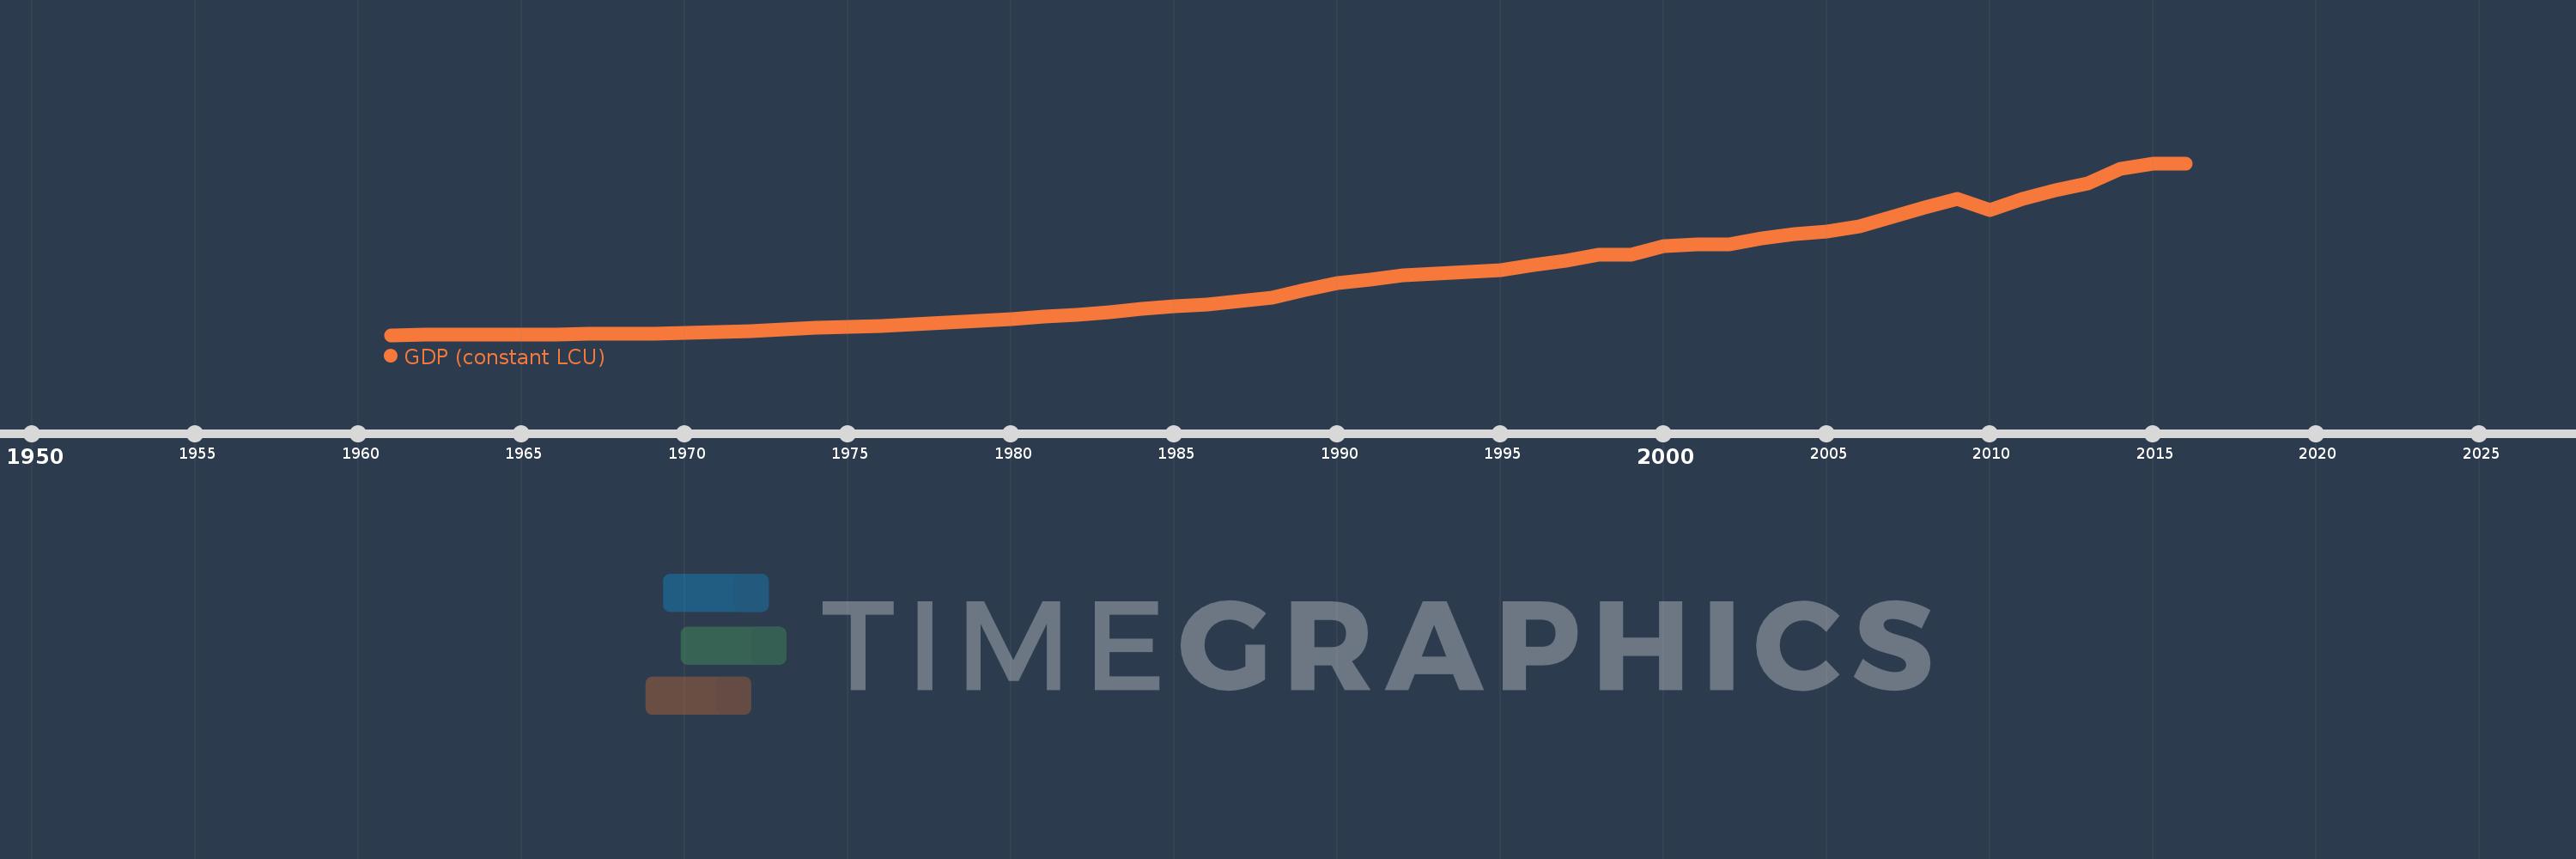
GDP (constant LCU)
2016,2015,2014,2013,2012,2011,2010,2009,2008,2007,2006,2005,2004,2003,2002,2001,2000,1999,1998,1997,1996,1995,1994,1993,1992,1991,1990,1989,1988,1987,1986,1985,1984,1983,1982,1981,1980,1979,1978,1977,1976,1975,1974,1973,1972,1971,1970,1969,1968,1967,1966,1965,1964,1963,1962,1961
Estas estadísticas en otros países:
AfghanistanAlbaniaAlgeriaAndorraAngolaAntigua and BarbudaArgentinaArmeniaArubaAustraliaAustriaAzerbaijanBahamas, TheBahrainBangladeshBarbadosBelarusBelgiumBelizeBeninBermudaBhutanBoliviaBosnia and HerzegovinaBotswanaBrazilBrunei DarussalamBulgariaBurkina FasoBurundiCabo VerdeCambodiaCameroonCanadaCayman IslandsCentral African RepublicChadChannel IslandsChileChinaColombiaComorosCongo, Dem. Rep.Congo, Rep.Costa RicaCote d'IvoireCroatiaCubaCyprusCzech RepublicDenmarkDjiboutiDominicaDominican RepublicEcuadorEgypt, Arab Rep.El SalvadorEquatorial GuineaEritreaEstoniaEthiopiaFijiFinlandFranceFrench PolynesiaGabonGambia, TheGeorgiaGermanyGhanaGreeceGreenlandGrenadaGuatemalaGuineaGuinea-BissauGuyanaHaitiHondurasHong Kong SAR, ChinaHungaryIcelandIndiaIndonesiaIran, Islamic Rep.IraqIrelandIsle of ManIsraelItalyJamaicaJapanJordanKazakhstanKenyaKiribatiKorea, Rep.KosovoKuwaitKyrgyz RepublicLao PDRLatviaLebanonLesothoLiberiaLibyaLiechtensteinLithuaniaLuxembourgMacao SAR, ChinaMacedonia, FYRMadagascarMalawiMalaysiaMaldivesMaliMaltaMarshall IslandsMauritaniaMauritiusMexicoMicronesia, Fed. Sts.MoldovaMonacoMongoliaMontenegroMoroccoMozambiqueMyanmarNamibiaNauruNepalNetherlandsNew CaledoniaNew ZealandNicaraguaNigerNigeriaNorwayOmanPakistanPalauPanamaPapua New GuineaParaguayPeruPhilippinesPolandPortugalPuerto RicoQatarRomaniaRussian FederationRwandaSamoaSan MarinoSao Tome and PrincipeSaudi ArabiaSenegalSerbiaSeychellesSierra LeoneSingaporeSlovak RepublicSloveniaSolomon IslandsSomaliaSouth AfricaSouth SudanSpainSri LankaSt. Kitts and NevisSt. LuciaSt. Vincent and the GrenadinesSudanSurinameSwazilandSwedenSwitzerlandSyrian Arab RepublicTajikistanTanzaniaThailandTimor-LesteTogoTongaTrinidad and TobagoTunisiaTurkeyTurkmenistanTuvaluUgandaUkraineUnited Arab EmiratesUnited KingdomUnited StatesUruguayUzbekistanVanuatuVenezuela, RBVietnamVirgin Islands (U.S.)West Bank and GazaYemen, Rep.ZambiaZimbabwe línea de tiempo (timeline):
En esta escala de tiempo se presenta un gráfico de 1961 y 2016 de Botswana. Los datos de 1960 están ausentes. El número de observaciones reales por fecha: 56.
Fuente (nombre):
Indicadores del desarrollo mundial
Fuente (organización):
World Bank national accounts data, and OECD National Accounts data files.
Categorías:
Economy & Growth
Se ha actualizado:
23 abr 2017 año
Los indicadores de los cambios de valor en los últimos años
Mínimo:
1.093 bn
1 ene 1961 año
Máximo:
85.619 bn
1 ene 2015 año
A la fecha de observación
Valor
Cambio absoluto
El cambio con respecto al valor anterior
1 ene 1961 año
1.093 bn
+1.093 bn
0.0%
1 ene 1962 año
1.162 bn
+69.331 millones
6.34%
1 ene 1963 año
1.24 bn
+77.488 millones
6.67%
1 ene 1964 año
1.313 bn
+73.409 millones
5.92%
1 ene 1965 año
1.403 bn
+89.722 millones
6.83%
1 ene 1966 año
1.484 bn
+81.566 millones
5.81%
1 ene 1967 año
1.579 bn
+94.177 millones
6.34%
1 ene 1968 año
1.672 bn
+93.53 millones
5.92%
1 ene 1969 año
1.849 bn
+176.703 millones
10.57%
1 ene 1970 año
2.129 bn
+279.618 millones
15.12%
1 ene 1971 año
2.493 bn
+364.409 millones
17.12%
1 ene 1972 año
3.137 bn
+643.704 millones
25.82%
1 ene 1973 año
3.964 bn
+826.879 millones
26.36%
1 ene 1974 año
4.808 bn
+844.356 millones
21.3%
1 ene 1975 año
5.231 bn
+422.987 millones
8.8%
1 ene 1976 año
5.673 bn
+441.812 millones
8.45%
1 ene 1977 año
6.277 bn
+603.991 millones
10.65%
1 ene 1978 año
7.031 bn
+753.955 millones
12.01%
1 ene 1979 año
8.038 bn
+1.008 bn
14.33%
1 ene 1980 año
9.015 bn
+976.54 millones
12.15%
1 ene 1981 año
10.095 bn
+1.081 bn
11.99%
1 ene 1982 año
11.011 bn
+915.138 millones
9.06%
1 ene 1983 año
12.35 bn
+1.339 bn
12.17%
1 ene 1984 año
13.974 bn
+1.624 bn
13.15%
1 ene 1985 año
15.168 bn
+1.194 bn
8.55%
1 ene 1986 año
16.249 bn
+1.081 bn
7.13%
1 ene 1987 año
17.577 bn
+1.328 bn
8.17%
1 ene 1988 año
19.665 bn
+2.088 bn
11.88%
1 ene 1989 año
23.49 bn
+3.825 bn
19.45%
1 ene 1990 año
26.557 bn
+3.068 bn
13.06%
1 ene 1991 año
28.356 bn
+1.799 bn
6.77%
1 ene 1992 año
30.471 bn
+2.115 bn
7.46%
1 ene 1993 año
31.36 bn
+888.864 millones
2.92%
1 ene 1994 año
31.961 bn
+600.891 millones
1.92%
1 ene 1995 año
33.12 bn
+1.16 bn
3.63%
1 ene 1996 año
35.449 bn
+2.329 bn
7.03%
1 ene 1997 año
37.516 bn
+2.067 bn
5.83%
1 ene 1998 año
40.527 bn
+3.011 bn
8.03%
1 ene 1999 año
40.819 bn
+292.6 millones
0.72%
1 ene 2000 año
44.765 bn
+3.946 bn
9.67%
1 ene 2001 año
45.655 bn
+889.8 millones
1.99%
1 ene 2002 año
45.77 bn
+114.4 millones
0.25%
1 ene 2003 año
48.548 bn
+2.778 bn
6.07%
1 ene 2004 año
50.793 bn
+2.246 bn
4.63%
1 ene 2005 año
52.168 bn
+1.374 bn
2.71%
1 ene 2006 año
54.545 bn
+2.377 bn
4.56%
1 ene 2007 año
59.107 bn
+4.562 bn
8.36%
1 ene 2008 año
63.999 bn
+4.892 bn
8.28%
1 ene 2009 año
67.996 bn
+3.997 bn
6.25%
1 ene 2010 año
62.793 bn
-5.203 bn
-7.65%
1 ene 2011 año
68.17 bn
+5.377 bn
8.56%
1 ene 2012 año
72.293 bn
+4.123 bn
6.05%
1 ene 2013 año
75.515 bn
+3.222 bn
4.46%
1 ene 2014 año
82.961 bn
+7.446 bn
9.86%
1 ene 2015 año
85.619 bn
+2.659 bn
3.2%
1 ene 2016 año
85.401 bn
-218.279 millones
-0.25%
Ranking de los países por los datos estadísticos actuales


Comentarios: