29
/es/
es
AIzaSyAYiBZKx7MnpbEhh9jyipgxe19OcubqV5w
April 1, 2024
197541
Moldova
MDA
true
2
1
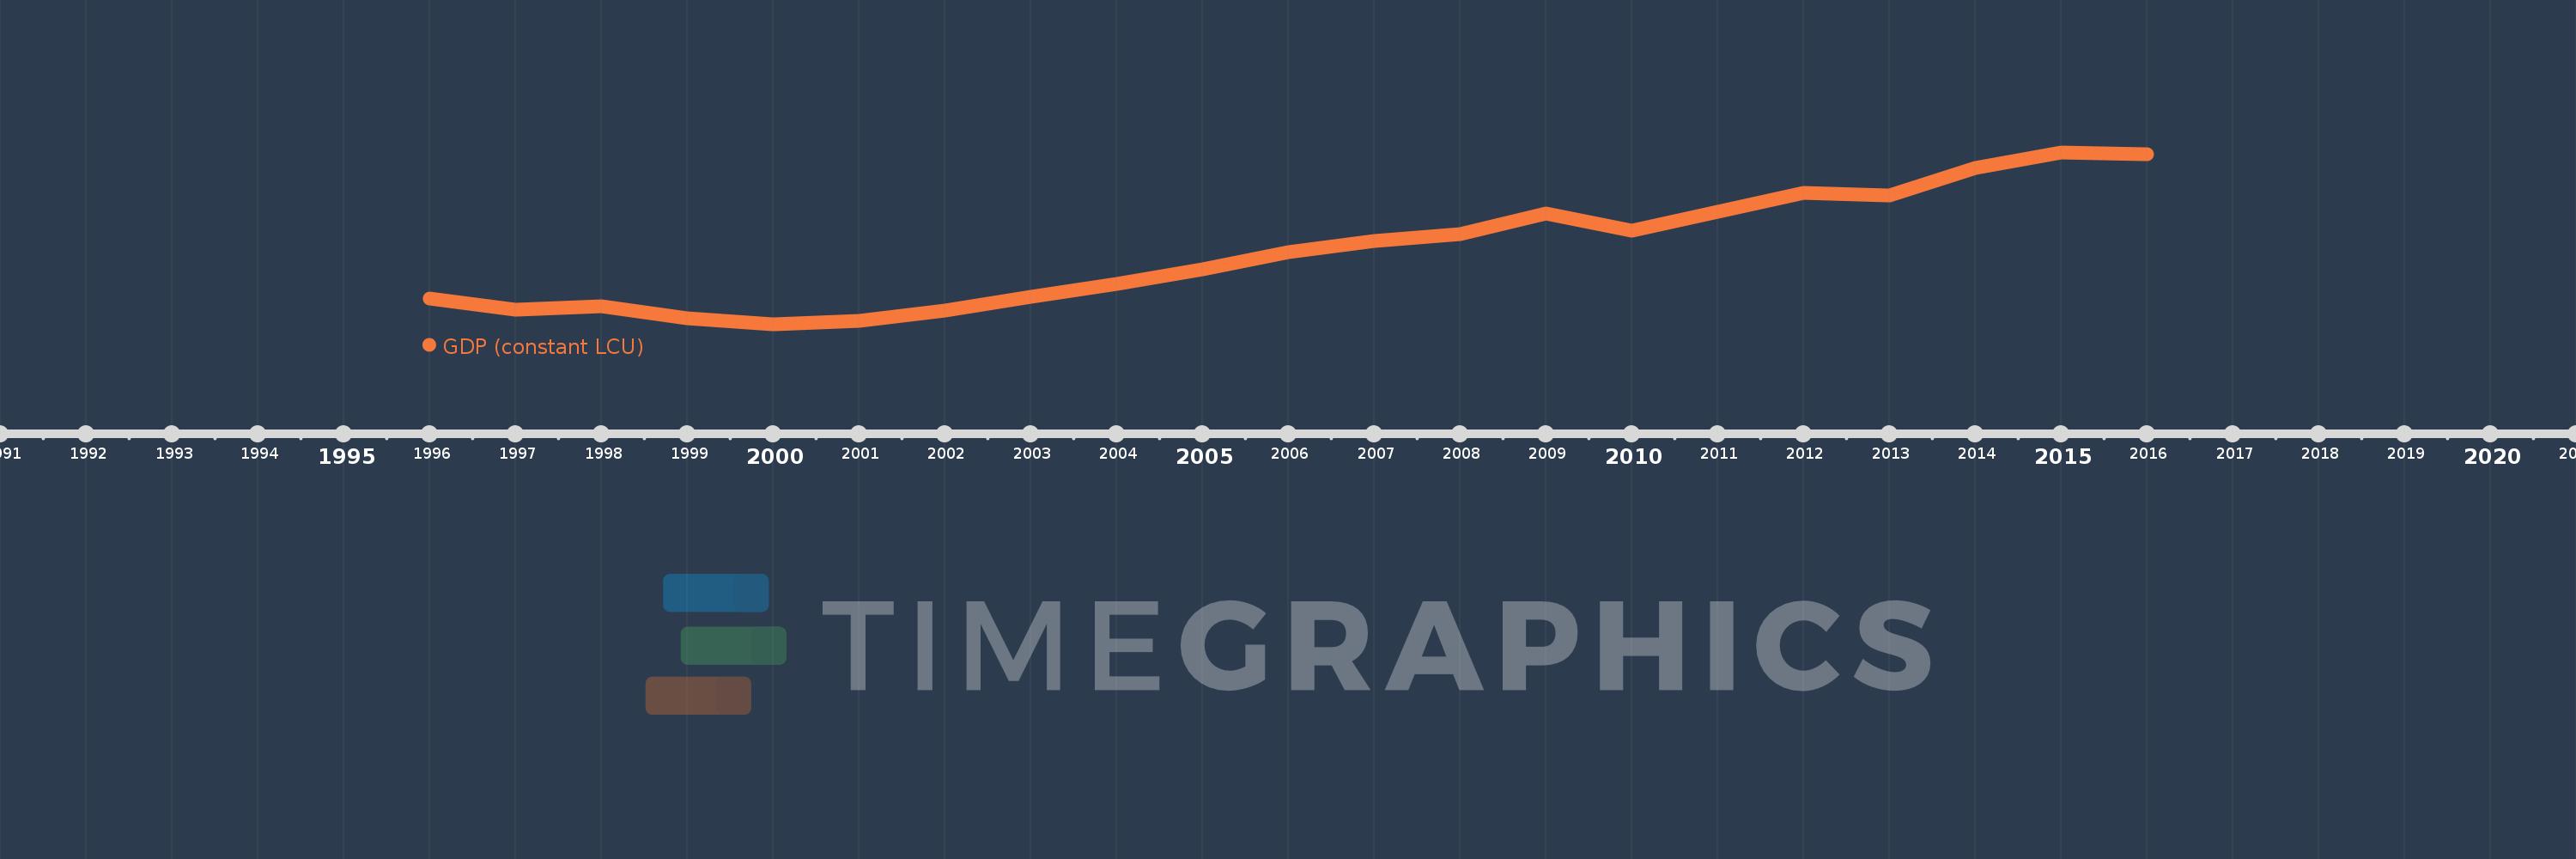
GDP (constant LCU)
2016,2015,2014,2013,2012,2011,2010,2009,2008,2007,2006,2005,2004,2003,2002,2001,2000,1999,1998,1997,1996
Estas estadísticas en otros países:
AfghanistanAlbaniaAlgeriaAndorraAngolaAntigua and BarbudaArgentinaArmeniaArubaAustraliaAustriaAzerbaijanBahamas, TheBahrainBangladeshBarbadosBelarusBelgiumBelizeBeninBermudaBhutanBoliviaBosnia and HerzegovinaBotswanaBrazilBrunei DarussalamBulgariaBurkina FasoBurundiCabo VerdeCambodiaCameroonCanadaCayman IslandsCentral African RepublicChadChannel IslandsChileChinaColombiaComorosCongo, Dem. Rep.Congo, Rep.Costa RicaCote d'IvoireCroatiaCubaCyprusCzech RepublicDenmarkDjiboutiDominicaDominican RepublicEcuadorEgypt, Arab Rep.El SalvadorEquatorial GuineaEritreaEstoniaEthiopiaFijiFinlandFranceFrench PolynesiaGabonGambia, TheGeorgiaGermanyGhanaGreeceGreenlandGrenadaGuatemalaGuineaGuinea-BissauGuyanaHaitiHondurasHong Kong SAR, ChinaHungaryIcelandIndiaIndonesiaIran, Islamic Rep.IraqIrelandIsle of ManIsraelItalyJamaicaJapanJordanKazakhstanKenyaKiribatiKorea, Rep.KosovoKuwaitKyrgyz RepublicLao PDRLatviaLebanonLesothoLiberiaLibyaLiechtensteinLithuaniaLuxembourgMacao SAR, ChinaMacedonia, FYRMadagascarMalawiMalaysiaMaldivesMaliMaltaMarshall IslandsMauritaniaMauritiusMexicoMicronesia, Fed. Sts.MoldovaMonacoMongoliaMontenegroMoroccoMozambiqueMyanmarNamibiaNauruNepalNetherlandsNew CaledoniaNew ZealandNicaraguaNigerNigeriaNorwayOmanPakistanPalauPanamaPapua New GuineaParaguayPeruPhilippinesPolandPortugalPuerto RicoQatarRomaniaRussian FederationRwandaSamoaSan MarinoSao Tome and PrincipeSaudi ArabiaSenegalSerbiaSeychellesSierra LeoneSingaporeSlovak RepublicSloveniaSolomon IslandsSomaliaSouth AfricaSouth SudanSpainSri LankaSt. Kitts and NevisSt. LuciaSt. Vincent and the GrenadinesSudanSurinameSwazilandSwedenSwitzerlandSyrian Arab RepublicTajikistanTanzaniaThailandTimor-LesteTogoTongaTrinidad and TobagoTunisiaTurkeyTurkmenistanTuvaluUgandaUkraineUnited Arab EmiratesUnited KingdomUnited StatesUruguayUzbekistanVanuatuVenezuela, RBVietnamVirgin Islands (U.S.)West Bank and GazaYemen, Rep.ZambiaZimbabwe línea de tiempo (timeline):
En esta escala de tiempo se presenta un gráfico de 1996 y 2016 de Moldova. Los datos de 1995 están ausentes. El número de observaciones reales por fecha: 21.
Fuente (nombre):
Indicadores del desarrollo mundial
Fuente (organización):
World Bank national accounts data, and OECD National Accounts data files.
Categorías:
Economy & Growth
Se ha actualizado:
23 abr 2017 año
Los indicadores de los cambios de valor en los últimos años
Mínimo:
15.689 bn
1 ene 2000 año
Máximo:
32.121 bn
1 ene 2015 año
A la fecha de observación
Valor
Cambio absoluto
El cambio con respecto al valor anterior
1 ene 1996 año
18.158 bn
+18.158 bn
0.0%
1 ene 1997 año
17.091 bn
-1.067 bn
-5.88%
1 ene 1998 año
17.372 bn
+281.496 millones
1.65%
1 ene 1999 año
16.236 bn
-1.137 bn
-6.54%
1 ene 2000 año
15.689 bn
-546.861 millones
-3.37%
1 ene 2001 año
16.02 bn
+330.677 millones
2.11%
1 ene 2002 año
16.997 bn
+977.193 millones
6.1%
1 ene 2003 año
18.322 bn
+1.326 bn
7.8%
1 ene 2004 año
19.532 bn
+1.209 bn
6.6%
1 ene 2005 año
20.977 bn
+1.445 bn
7.4%
1 ene 2006 año
22.55 bn
+1.573 bn
7.5%
1 ene 2007 año
23.633 bn
+1.082 bn
4.8%
1 ene 2008 año
24.342 bn
+708.985 millones
3.0%
1 ene 2009 año
26.24 bn
+1.899 bn
7.8%
1 ene 2010 año
24.666 bn
-1.574 bn
-6.0%
1 ene 2011 año
26.417 bn
+1.751 bn
7.1%
1 ene 2012 año
28.214 bn
+1.796 bn
6.8%
1 ene 2013 año
28.016 bn
-197.496 millones
-0.7%
1 ene 2014 año
30.65 bn
+2.634 bn
9.4%
1 ene 2015 año
32.121 bn
+1.471 bn
4.8%
1 ene 2016 año
31.96 bn
-160.605 millones
-0.5%
Ranking de los países por los datos estadísticos actuales


Comentarios: