29
/es/
es
AIzaSyAYiBZKx7MnpbEhh9jyipgxe19OcubqV5w
April 1, 2024
262235
Thailand
THA
true
2
1
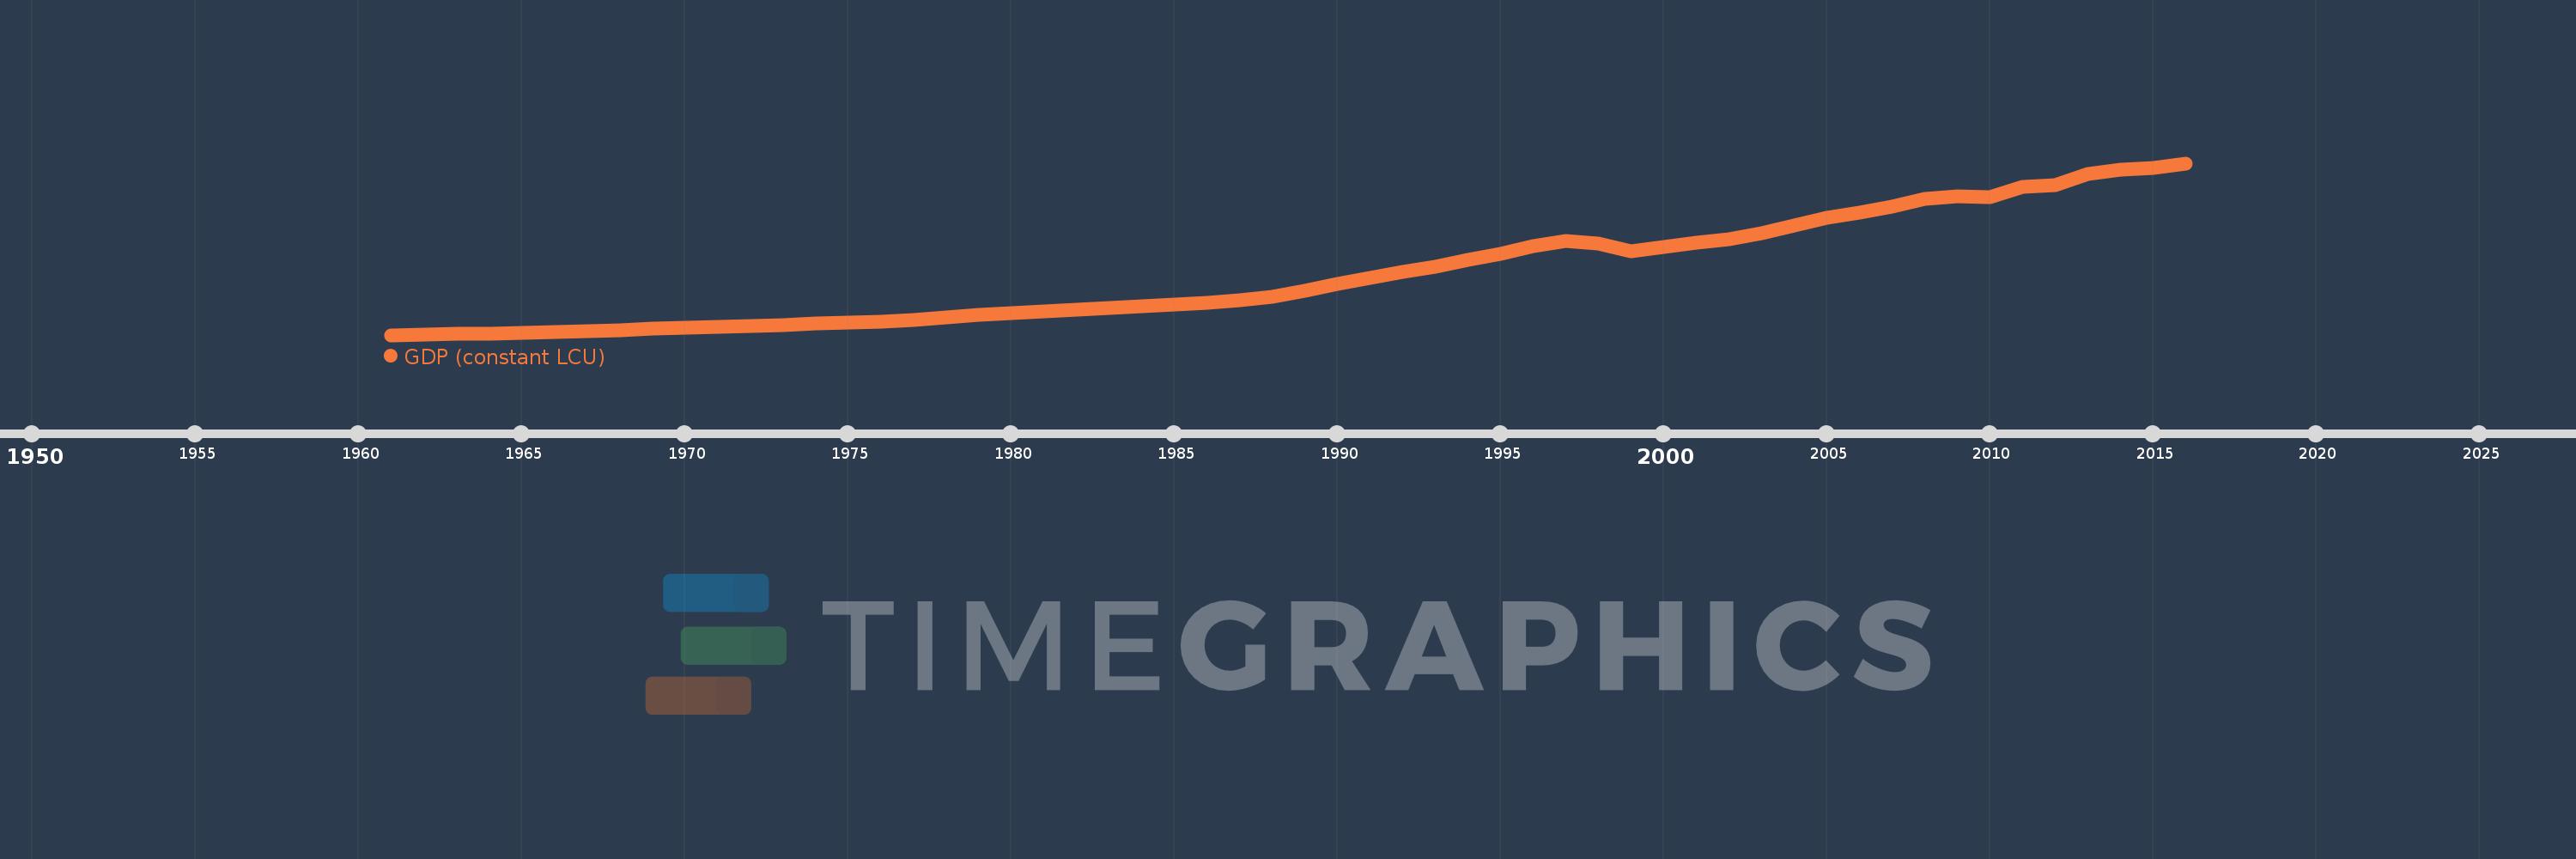
GDP (constant LCU)
2016,2015,2014,2013,2012,2011,2010,2009,2008,2007,2006,2005,2004,2003,2002,2001,2000,1999,1998,1997,1996,1995,1994,1993,1992,1991,1990,1989,1988,1987,1986,1985,1984,1983,1982,1981,1980,1979,1978,1977,1976,1975,1974,1973,1972,1971,1970,1969,1968,1967,1966,1965,1964,1963,1962,1961
Estas estadísticas en otros países:
AfghanistanAlbaniaAlgeriaAndorraAngolaAntigua and BarbudaArgentinaArmeniaArubaAustraliaAustriaAzerbaijanBahamas, TheBahrainBangladeshBarbadosBelarusBelgiumBelizeBeninBermudaBhutanBoliviaBosnia and HerzegovinaBotswanaBrazilBrunei DarussalamBulgariaBurkina FasoBurundiCabo VerdeCambodiaCameroonCanadaCayman IslandsCentral African RepublicChadChannel IslandsChileChinaColombiaComorosCongo, Dem. Rep.Congo, Rep.Costa RicaCote d'IvoireCroatiaCubaCyprusCzech RepublicDenmarkDjiboutiDominicaDominican RepublicEcuadorEgypt, Arab Rep.El SalvadorEquatorial GuineaEritreaEstoniaEthiopiaFijiFinlandFranceFrench PolynesiaGabonGambia, TheGeorgiaGermanyGhanaGreeceGreenlandGrenadaGuatemalaGuineaGuinea-BissauGuyanaHaitiHondurasHong Kong SAR, ChinaHungaryIcelandIndiaIndonesiaIran, Islamic Rep.IraqIrelandIsle of ManIsraelItalyJamaicaJapanJordanKazakhstanKenyaKiribatiKorea, Rep.KosovoKuwaitKyrgyz RepublicLao PDRLatviaLebanonLesothoLiberiaLibyaLiechtensteinLithuaniaLuxembourgMacao SAR, ChinaMacedonia, FYRMadagascarMalawiMalaysiaMaldivesMaliMaltaMarshall IslandsMauritaniaMauritiusMexicoMicronesia, Fed. Sts.MoldovaMonacoMongoliaMontenegroMoroccoMozambiqueMyanmarNamibiaNauruNepalNetherlandsNew CaledoniaNew ZealandNicaraguaNigerNigeriaNorwayOmanPakistanPalauPanamaPapua New GuineaParaguayPeruPhilippinesPolandPortugalPuerto RicoQatarRomaniaRussian FederationRwandaSamoaSan MarinoSao Tome and PrincipeSaudi ArabiaSenegalSerbiaSeychellesSierra LeoneSingaporeSlovak RepublicSloveniaSolomon IslandsSomaliaSouth AfricaSouth SudanSpainSri LankaSt. Kitts and NevisSt. LuciaSt. Vincent and the GrenadinesSudanSurinameSwazilandSwedenSwitzerlandSyrian Arab RepublicTajikistanTanzaniaThailandTimor-LesteTogoTongaTrinidad and TobagoTunisiaTurkeyTurkmenistanTuvaluUgandaUkraineUnited Arab EmiratesUnited KingdomUnited StatesUruguayUzbekistanVanuatuVenezuela, RBVietnamVirgin Islands (U.S.)West Bank and GazaYemen, Rep.ZambiaZimbabwe línea de tiempo (timeline):
En esta escala de tiempo se presenta un gráfico de 1961 y 2016 de Thailand. Los datos de 1960 están ausentes. El número de observaciones reales por fecha: 56.
Fuente (nombre):
Indicadores del desarrollo mundial
Fuente (organización):
World Bank national accounts data, and OECD National Accounts data files.
Categorías:
Economy & Growth
Se ha actualizado:
23 abr 2017 año
Los indicadores de los cambios de valor en los últimos años
En promedio:
3.628 billones
Mínimo:
377.461 bn
1 ene 1961 año
Máximo:
9.472 billones
1 ene 2016 año
A la fecha de observación
Valor
Cambio absoluto
El cambio con respecto al valor anterior
1 ene 1961 año
377.461 bn
+377.461 bn
0.0%
1 ene 1962 año
397.701 bn
+20.24 bn
5.36%
1 ene 1963 año
427.745 bn
+30.043 bn
7.55%
1 ene 1964 año
461.964 bn
+34.219 bn
8.0%
1 ene 1965 año
493.52 bn
+31.557 bn
6.83%
1 ene 1966 año
533.899 bn
+40.378 bn
8.18%
1 ene 1967 año
593.282 bn
+59.383 bn
11.12%
1 ene 1968 año
644.399 bn
+51.117 bn
8.62%
1 ene 1969 año
696.738 bn
+52.34 bn
8.12%
1 ene 1970 año
742.379 bn
+45.641 bn
6.55%
1 ene 1971 año
827.07 bn
+84.69 bn
11.41%
1 ene 1972 año
867.558 bn
+40.488 bn
4.9%
1 ene 1973 año
904.676 bn
+37.119 bn
4.28%
1 ene 1974 año
997.283 bn
+92.607 bn
10.24%
1 ene 1975 año
1.042 billones
+44.541 bn
4.47%
1 ene 1976 año
1.094 billones
+51.783 bn
4.97%
1 ene 1977 año
1.196 billones
+101.999 bn
9.33%
1 ene 1978 año
1.313 billones
+117.689 bn
9.84%
1 ene 1979 año
1.449 billones
+135.213 bn
10.3%
1 ene 1980 año
1.526 billones
+77.81 bn
5.37%
1 ene 1981 año
1.605 billones
+78.965 bn
5.17%
1 ene 1982 año
1.7 billones
+94.822 bn
5.91%
1 ene 1983 año
1.791 billones
+90.996 bn
5.35%
1 ene 1984 año
1.891 billones
+100.019 bn
5.58%
1 ene 1985 año
2.0 billones
+108.785 bn
5.75%
1 ene 1986 año
2.093 billones
+92.94 bn
4.65%
1 ene 1987 año
2.209 billones
+115.814 bn
5.53%
1 ene 1988 año
2.419 billones
+210.241 bn
9.52%
1 ene 1989 año
2.74 billones
+321.426 bn
13.29%
1 ene 1990 año
3.074 billones
+334.06 bn
12.19%
1 ene 1991 año
3.418 billones
+343.322 bn
11.17%
1 ene 1992 año
3.71 billones
+292.496 bn
8.56%
1 ene 1993 año
4.01 billones
+299.91 bn
8.08%
1 ene 1994 año
4.341 billones
+330.876 bn
8.25%
1 ene 1995 año
4.688 billones
+347.145 bn
8.0%
1 ene 1996 año
5.069 billones
+380.689 bn
8.12%
1 ene 1997 año
5.355 billones
+286.509 bn
5.65%
1 ene 1998 año
5.208 billones
-147.464 bn
-2.75%
1 ene 1999 año
4.81 billones
-397.555 bn
-7.63%
1 ene 2000 año
5.03 billones
+219.942 bn
4.57%
1 ene 2001 año
5.254 billones
+224.132 bn
4.46%
1 ene 2002 año
5.435 billones
+180.974 bn
3.44%
1 ene 2003 año
5.77 billones
+334.214 bn
6.15%
1 ene 2004 año
6.184 billones
+414.794 bn
7.19%
1 ene 2005 año
6.573 billones
+388.953 bn
6.29%
1 ene 2006 año
6.849 billones
+275.28 bn
4.19%
1 ene 2007 año
7.189 billones
+340.233 bn
4.97%
1 ene 2008 año
7.58 billones
+390.72 bn
5.44%
1 ene 2009 año
7.71 billones
+130.798 bn
1.73%
1 ene 2010 año
7.653 billones
-56.924 bn
-0.74%
1 ene 2011 año
8.228 billones
+574.521 bn
7.51%
1 ene 2012 año
8.297 billones
+68.595 bn
0.83%
1 ene 2013 año
8.896 billones
+599.92 bn
7.23%
1 ene 2014 año
9.137 billones
+240.393 bn
2.7%
1 ene 2015 año
9.212 billones
+74.706 bn
0.82%
1 ene 2016 año
9.472 billones
+260.534 bn
2.83%
Ranking de los países por los datos estadísticos actuales


Comentarios: