29
/es/
es
AIzaSyAYiBZKx7MnpbEhh9jyipgxe19OcubqV5w
April 1, 2024
274760
United Arab Emirates
ARE
true
2
1
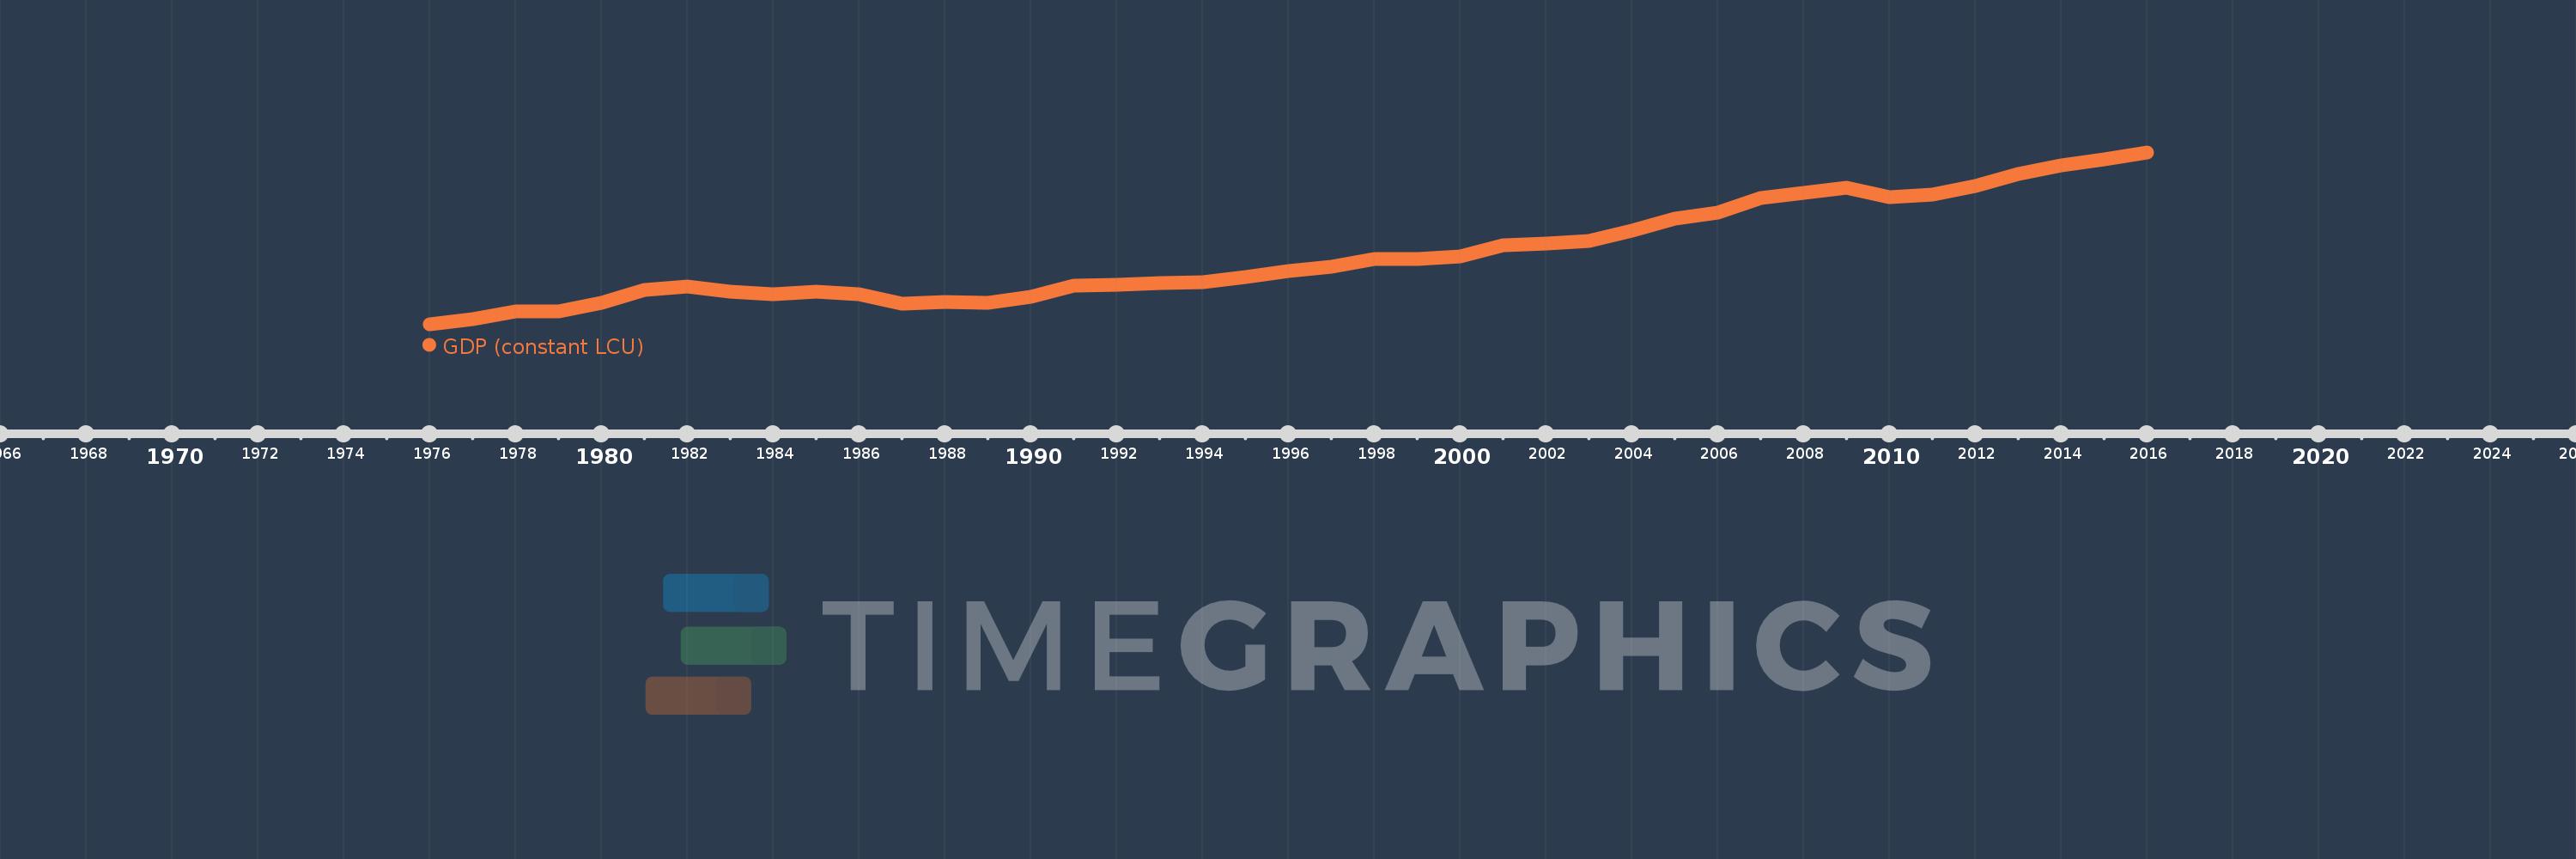
GDP (constant LCU)
2016,2015,2014,2013,2012,2011,2010,2009,2008,2007,2006,2005,2004,2003,2002,2001,2000,1999,1998,1997,1996,1995,1994,1993,1992,1991,1990,1989,1988,1987,1986,1985,1984,1983,1982,1981,1980,1979,1978,1977,1976
Estas estadísticas en otros países:
AfghanistanAlbaniaAlgeriaAndorraAngolaAntigua and BarbudaArgentinaArmeniaArubaAustraliaAustriaAzerbaijanBahamas, TheBahrainBangladeshBarbadosBelarusBelgiumBelizeBeninBermudaBhutanBoliviaBosnia and HerzegovinaBotswanaBrazilBrunei DarussalamBulgariaBurkina FasoBurundiCabo VerdeCambodiaCameroonCanadaCayman IslandsCentral African RepublicChadChannel IslandsChileChinaColombiaComorosCongo, Dem. Rep.Congo, Rep.Costa RicaCote d'IvoireCroatiaCubaCyprusCzech RepublicDenmarkDjiboutiDominicaDominican RepublicEcuadorEgypt, Arab Rep.El SalvadorEquatorial GuineaEritreaEstoniaEthiopiaFijiFinlandFranceFrench PolynesiaGabonGambia, TheGeorgiaGermanyGhanaGreeceGreenlandGrenadaGuatemalaGuineaGuinea-BissauGuyanaHaitiHondurasHong Kong SAR, ChinaHungaryIcelandIndiaIndonesiaIran, Islamic Rep.IraqIrelandIsle of ManIsraelItalyJamaicaJapanJordanKazakhstanKenyaKiribatiKorea, Rep.KosovoKuwaitKyrgyz RepublicLao PDRLatviaLebanonLesothoLiberiaLibyaLiechtensteinLithuaniaLuxembourgMacao SAR, ChinaMacedonia, FYRMadagascarMalawiMalaysiaMaldivesMaliMaltaMarshall IslandsMauritaniaMauritiusMexicoMicronesia, Fed. Sts.MoldovaMonacoMongoliaMontenegroMoroccoMozambiqueMyanmarNamibiaNauruNepalNetherlandsNew CaledoniaNew ZealandNicaraguaNigerNigeriaNorwayOmanPakistanPalauPanamaPapua New GuineaParaguayPeruPhilippinesPolandPortugalPuerto RicoQatarRomaniaRussian FederationRwandaSamoaSan MarinoSao Tome and PrincipeSaudi ArabiaSenegalSerbiaSeychellesSierra LeoneSingaporeSlovak RepublicSloveniaSolomon IslandsSomaliaSouth AfricaSouth SudanSpainSri LankaSt. Kitts and NevisSt. LuciaSt. Vincent and the GrenadinesSudanSurinameSwazilandSwedenSwitzerlandSyrian Arab RepublicTajikistanTanzaniaThailandTimor-LesteTogoTongaTrinidad and TobagoTunisiaTurkeyTurkmenistanTuvaluUgandaUkraineUnited Arab EmiratesUnited KingdomUnited StatesUruguayUzbekistanVanuatuVenezuela, RBVietnamVirgin Islands (U.S.)West Bank and GazaYemen, Rep.ZambiaZimbabwe línea de tiempo (timeline):
En esta escala de tiempo se presenta un gráfico de 1976 y 2016 de United Arab Emirates. Los datos de 1975 están ausentes. El número de observaciones reales por fecha: 41.
Fuente (nombre):
Indicadores del desarrollo mundial
Fuente (organización):
World Bank national accounts data, and OECD National Accounts data files.
Categorías:
Economy & Growth
Se ha actualizado:
23 abr 2017 año
Los indicadores de los cambios de valor en los últimos años
Mínimo:
184.469 bn
1 ene 1976 año
Máximo:
1.185 billones
1 ene 2016 año
A la fecha de observación
Valor
Cambio absoluto
El cambio con respecto al valor anterior
1 ene 1976 año
184.469 bn
+184.469 bn
0.0%
1 ene 1977 año
214.956 bn
+30.487 bn
16.53%
1 ene 1978 año
261.041 bn
+46.085 bn
21.44%
1 ene 1979 año
256.891 bn
-4.15 bn
-1.59%
1 ene 1980 año
310.642 bn
+53.751 bn
20.92%
1 ene 1981 año
384.807 bn
+74.165 bn
23.87%
1 ene 1982 año
402.736 bn
+17.929 bn
4.66%
1 ene 1983 año
375.675 bn
-27.061 bn
-6.72%
1 ene 1984 año
357.846 bn
-17.829 bn
-4.75%
1 ene 1985 año
372.221 bn
+14.375 bn
4.02%
1 ene 1986 año
358.841 bn
-13.379 bn
-3.59%
1 ene 1987 año
305.165 bn
-53.676 bn
-14.96%
1 ene 1988 año
315.486 bn
+10.321 bn
3.38%
1 ene 1989 año
307.224 bn
-8.262 bn
-2.62%
1 ene 1990 año
345.129 bn
+37.905 bn
12.34%
1 ene 1991 año
408.384 bn
+63.255 bn
18.33%
1 ene 1992 año
411.896 bn
+3.512 bn
0.86%
1 ene 1993 año
425.674 bn
+13.778 bn
3.34%
1 ene 1994 año
431.042 bn
+5.369 bn
1.26%
1 ene 1995 año
460.768 bn
+29.725 bn
6.9%
1 ene 1996 año
491.583 bn
+30.816 bn
6.69%
1 ene 1997 año
520.087 bn
+28.504 bn
5.8%
1 ene 1998 año
562.684 bn
+42.597 bn
8.19%
1 ene 1999 año
564.327 bn
+1.643 bn
0.29%
1 ene 2000 año
580.705 bn
+16.378 bn
2.9%
1 ene 2001 año
643.728 bn
+63.022 bn
10.85%
1 ene 2002 año
652.734 bn
+9.006 bn
1.4%
1 ene 2003 año
668.618 bn
+15.884 bn
2.43%
1 ene 2004 año
727.46 bn
+58.842 bn
8.8%
1 ene 2005 año
797.052 bn
+69.592 bn
9.57%
1 ene 2006 año
835.75 bn
+38.698 bn
4.86%
1 ene 2007 año
917.965 bn
+82.215 bn
9.84%
1 ene 2008 año
947.197 bn
+29.232 bn
3.18%
1 ene 2009 año
977.43 bn
+30.233 bn
3.19%
1 ene 2010 año
926.184 bn
-51.246 bn
-5.24%
1 ene 2011 año
941.331 bn
+15.147 bn
1.64%
1 ene 2012 año
990.354 bn
+49.023 bn
5.21%
1 ene 2013 año
1.058 billones
+67.271 bn
6.79%
1 ene 2014 año
1.108 billones
+50.014 bn
4.73%
1 ene 2015 año
1.142 billones
+34.114 bn
3.08%
1 ene 2016 año
1.185 billones
+42.903 bn
3.76%
Ranking de los países por los datos estadísticos actuales


Comentarios: