29
/es/
es
AIzaSyAYiBZKx7MnpbEhh9jyipgxe19OcubqV5w
April 1, 2024
89786
Botswana
BWA
true
2
1
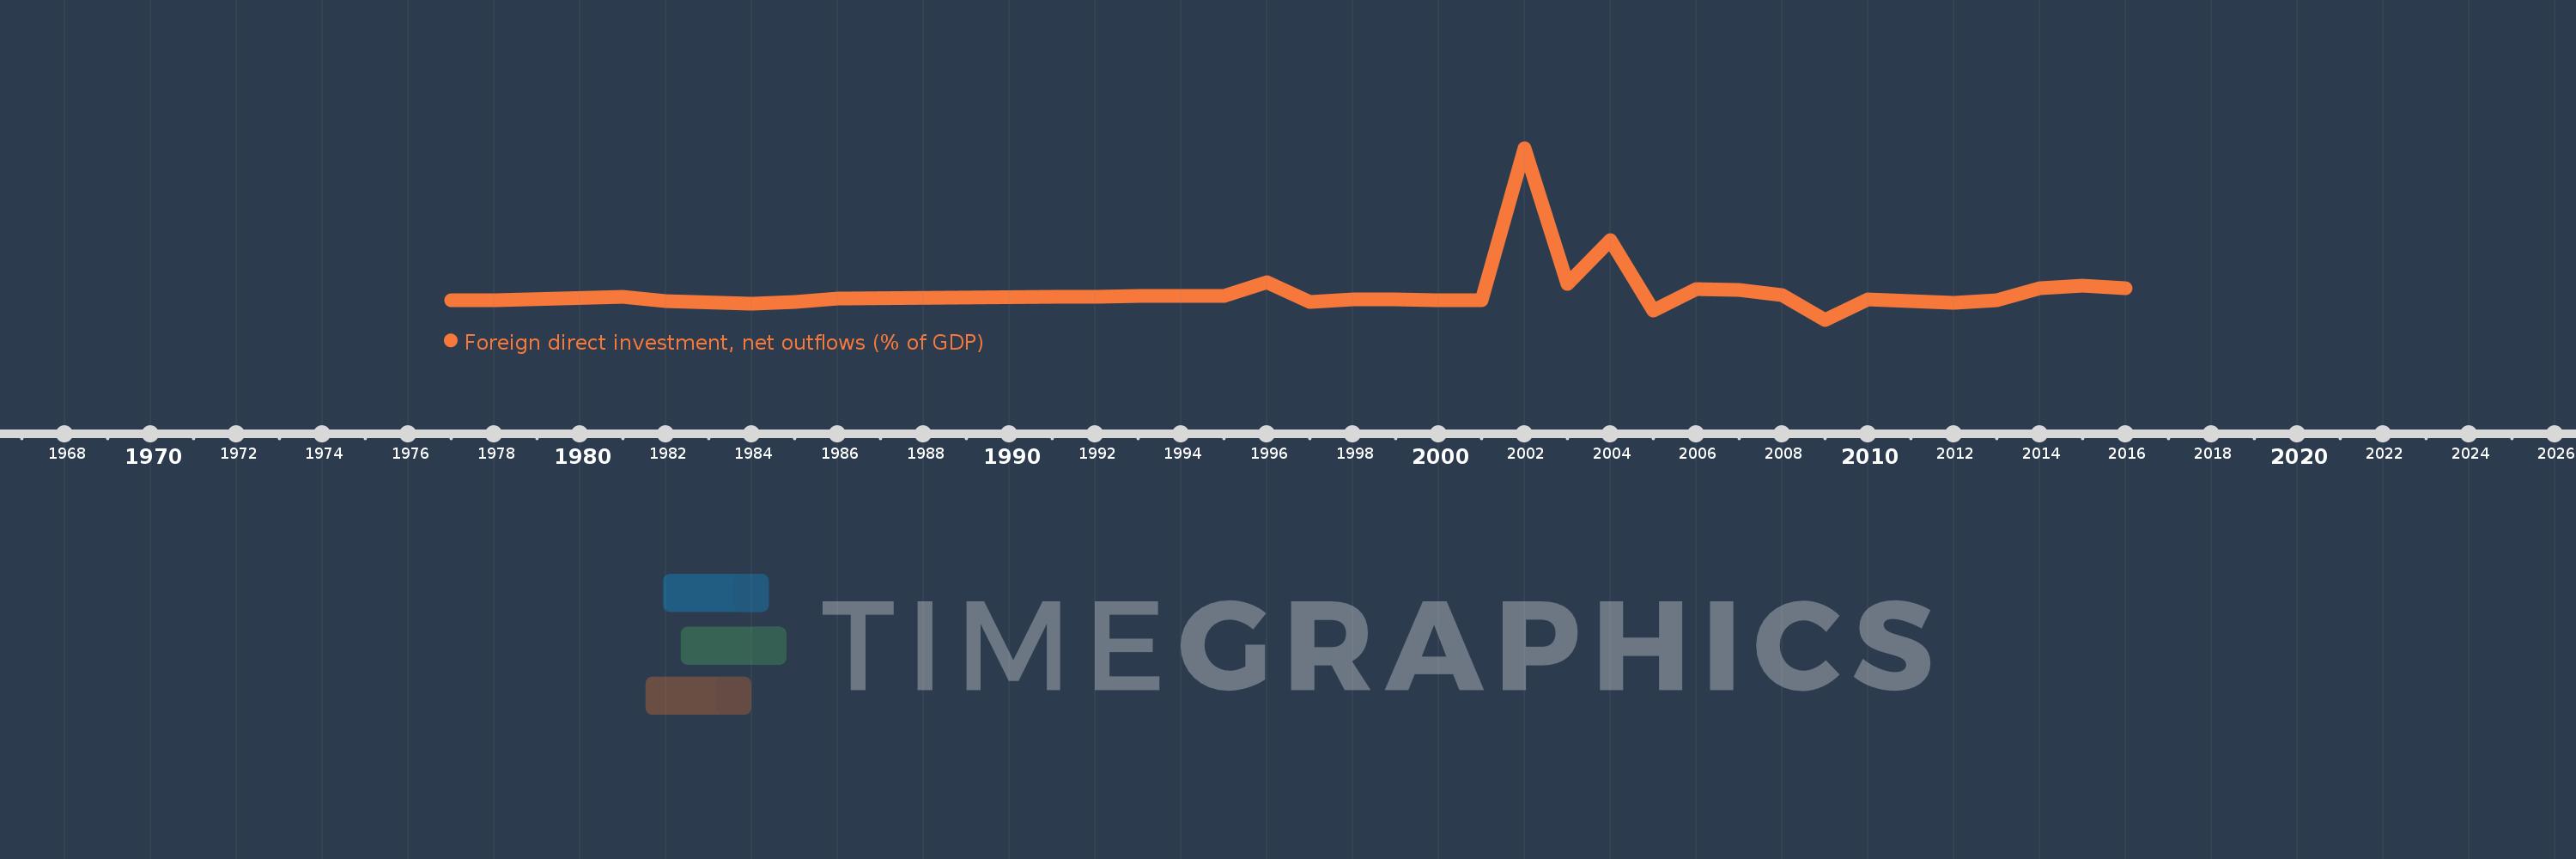
Foreign direct investment, net outflows (% of GDP)
2016,2015,2014,2013,2012,2011,2010,2009,2008,2007,2006,2005,2004,2003,2002,2001,2000,1999,1998,1997,1996,1995,1994,1993,1992,1991,1986,1985,1984,1982,1981,1978,1977
Estas estadísticas en otros países:
AfghanistanAlbaniaAlgeriaAngolaAntigua and BarbudaArab WorldArgentinaArmeniaArubaAustraliaAustriaAzerbaijanBahamas, TheBahrainBangladeshBarbadosBelarusBelgiumBelizeBeninBermudaBoliviaBosnia and HerzegovinaBotswanaBrazilBrunei DarussalamBulgariaBurkina FasoBurundiCabo VerdeCambodiaCameroonCanadaCaribbean small statesCayman IslandsCentral African RepublicCentral Europe and the BalticsChadChileChinaColombiaComorosCongo, Dem. Rep.Congo, Rep.Costa RicaCote d'IvoireCroatiaCyprusCzech RepublicDenmarkDominicaDominican RepublicEarly-demographic dividendEast Asia & PacificEast Asia & Pacific (excluding high income)East Asia & Pacific (IDA & IBRD countries)EcuadorEgypt, Arab Rep.El SalvadorEquatorial GuineaEritreaEstoniaEuro areaEurope & Central AsiaEurope & Central Asia (excluding high income)Europe & Central Asia (IDA & IBRD countries)European UnionFijiFinlandFragile and conflict affected situationsFranceFrench PolynesiaGabonGambia, TheGeorgiaGermanyGhanaGreeceGrenadaGuatemalaGuineaGuinea-BissauGuyanaHaitiHeavily indebted poor countries (HIPC)High incomeHondurasHong Kong SAR, ChinaHungaryIBRD onlyIcelandIDA & IBRD totalIDA blendIDA onlyIDA totalIndiaIndonesiaIran, Islamic Rep.IraqIrelandIsraelItalyJamaicaJapanJordanKazakhstanKenyaKiribatiKorea, Rep.KosovoKuwaitKyrgyz RepublicLao PDRLate-demographic dividendLatin America & Caribbean Latin America & Caribbean (excluding high income)Latin America & the Caribbean (IDA & IBRD countries)LatviaLeast developed countries: UN classificationLebanonLesothoLiberiaLibyaLithuaniaLow & middle incomeLow incomeLower middle incomeLuxembourgMacao SAR, ChinaMacedonia, FYRMadagascarMalawiMalaysiaMaliMaltaMarshall IslandsMauritaniaMauritiusMexicoMicronesia, Fed. Sts.Middle East & North AfricaMiddle East & North Africa (excluding high income)Middle East & North Africa (IDA & IBRD countries)Middle incomeMoldovaMongoliaMontenegroMoroccoMozambiqueNamibiaNauruNetherlandsNew ZealandNicaraguaNigerNigeriaNorth AmericaNorwayOECD membersOmanOther small statesPacific island small statesPakistanPalauPanamaPapua New GuineaParaguayPeruPhilippinesPolandPortugalPost-demographic dividendPre-demographic dividendQatarRomaniaRussian FederationRwandaSamoaSao Tome and PrincipeSaudi ArabiaSenegalSerbiaSeychellesSierra LeoneSingaporeSlovak RepublicSloveniaSmall statesSolomon IslandsSouth AfricaSouth AsiaSouth Asia (IDA & IBRD)SpainSri LankaSt. Kitts and NevisSt. LuciaSt. Vincent and the GrenadinesSub-Saharan Africa Sub-Saharan Africa (excluding high income)Sub-Saharan Africa (IDA & IBRD countries)SurinameSwazilandSwedenSwitzerlandSyrian Arab RepublicTajikistanTanzaniaThailandTimor-LesteTogoTongaTrinidad and TobagoTunisiaTurkeyUgandaUkraineUnited Arab EmiratesUnited KingdomUnited StatesUpper middle incomeUruguayVanuatuVenezuela, RBVietnamWest Bank and GazaWorldYemen, Rep.ZambiaZimbabwe línea de tiempo (timeline):
En esta escala de tiempo se presenta un gráfico de 1977 y 2016 de Botswana. Los datos de 1976 están ausentes. El número de observaciones reales por fecha: 33.
Fuente (nombre):
Indicadores del desarrollo mundial
Fuente (organización):
International Monetary Fund, International Financial Statistics and Balance of Payments databases, World Bank, International Debt Statistics, and World Bank and OECD GDP estimates.
Categorías:
Economy & Growth, Financial Sector
Se ha actualizado:
23 abr 2017 año
Los indicadores de los cambios de valor en los últimos años
Mínimo:
-0.835
1 ene 2009 año
Máximo:
6.916
1 ene 2002 año
A la fecha de observación
Valor
Cambio absoluto
El cambio con respecto al valor anterior
1 ene 1977 año
0.031
+0.031
0.0%
1 ene 1978 año
0.053
+0.022
70.15%
1 ene 1981 año
0.218
+0.166
315.04%
1 ene 1982 año
-0.011
-0.229
-105.1%
1 ene 1984 año
-0.109
-0.098
878.26%
1 ene 1985 año
-0.019
+0.09
-82.9%
1 ene 1986 año
0.132
+0.151
-808.95%
1 ene 1991 año
0.194
+0.062
47.15%
1 ene 1992 año
0.216
+0.022
11.08%
1 ene 1993 año
0.238
+0.022
10.18%
1 ene 1994 año
0.228
-0.01
-4.04%
1 ene 1995 año
0.222
-0.006
-2.65%
1 ene 1996 año
0.865
+0.643
289.28%
1 ene 1997 año
-0.022
-0.886
-102.51%
1 ene 1998 año
0.082
+0.103
-476.22%
1 ene 1999 año
0.073
-0.009
-10.67%
1 ene 2000 año
0.028
-0.045
-62.2%
1 ene 2001 año
0.039
+0.011
41.02%
1 ene 2002 año
6.916
+6.877
17.67 mil%
1 ene 2003 año
0.788
-6.128
-88.6%
1 ene 2004 año
2.743
+1.955
247.93%
1 ene 2005 año
-0.432
-3.175
-115.75%
1 ene 2006 año
0.563
+0.995
-230.21%
1 ene 2007 año
0.491
-0.071
-12.69%
1 ene 2008 año
0.289
-0.202
-41.12%
1 ene 2009 año
-0.835
-1.124
-388.65%
1 ene 2010 año
0.076
+0.911
-109.12%
1 ene 2011 año
0.007
-0.069
-90.8%
1 ene 2012 año
-0.062
-0.069
-983.09%
1 ene 2013 año
0.054
+0.116
-187.75%
1 ene 2014 año
0.571
+0.517
951.62%
1 ene 2015 año
0.701
+0.13
22.76%
1 ene 2016 año
0.587
-0.114
-16.31%
Ranking de los países por los datos estadísticos actuales


Comentarios: