29
/es/
es
AIzaSyAYiBZKx7MnpbEhh9jyipgxe19OcubqV5w
April 1, 2024
223547
Philippines
PHL
true
2
1
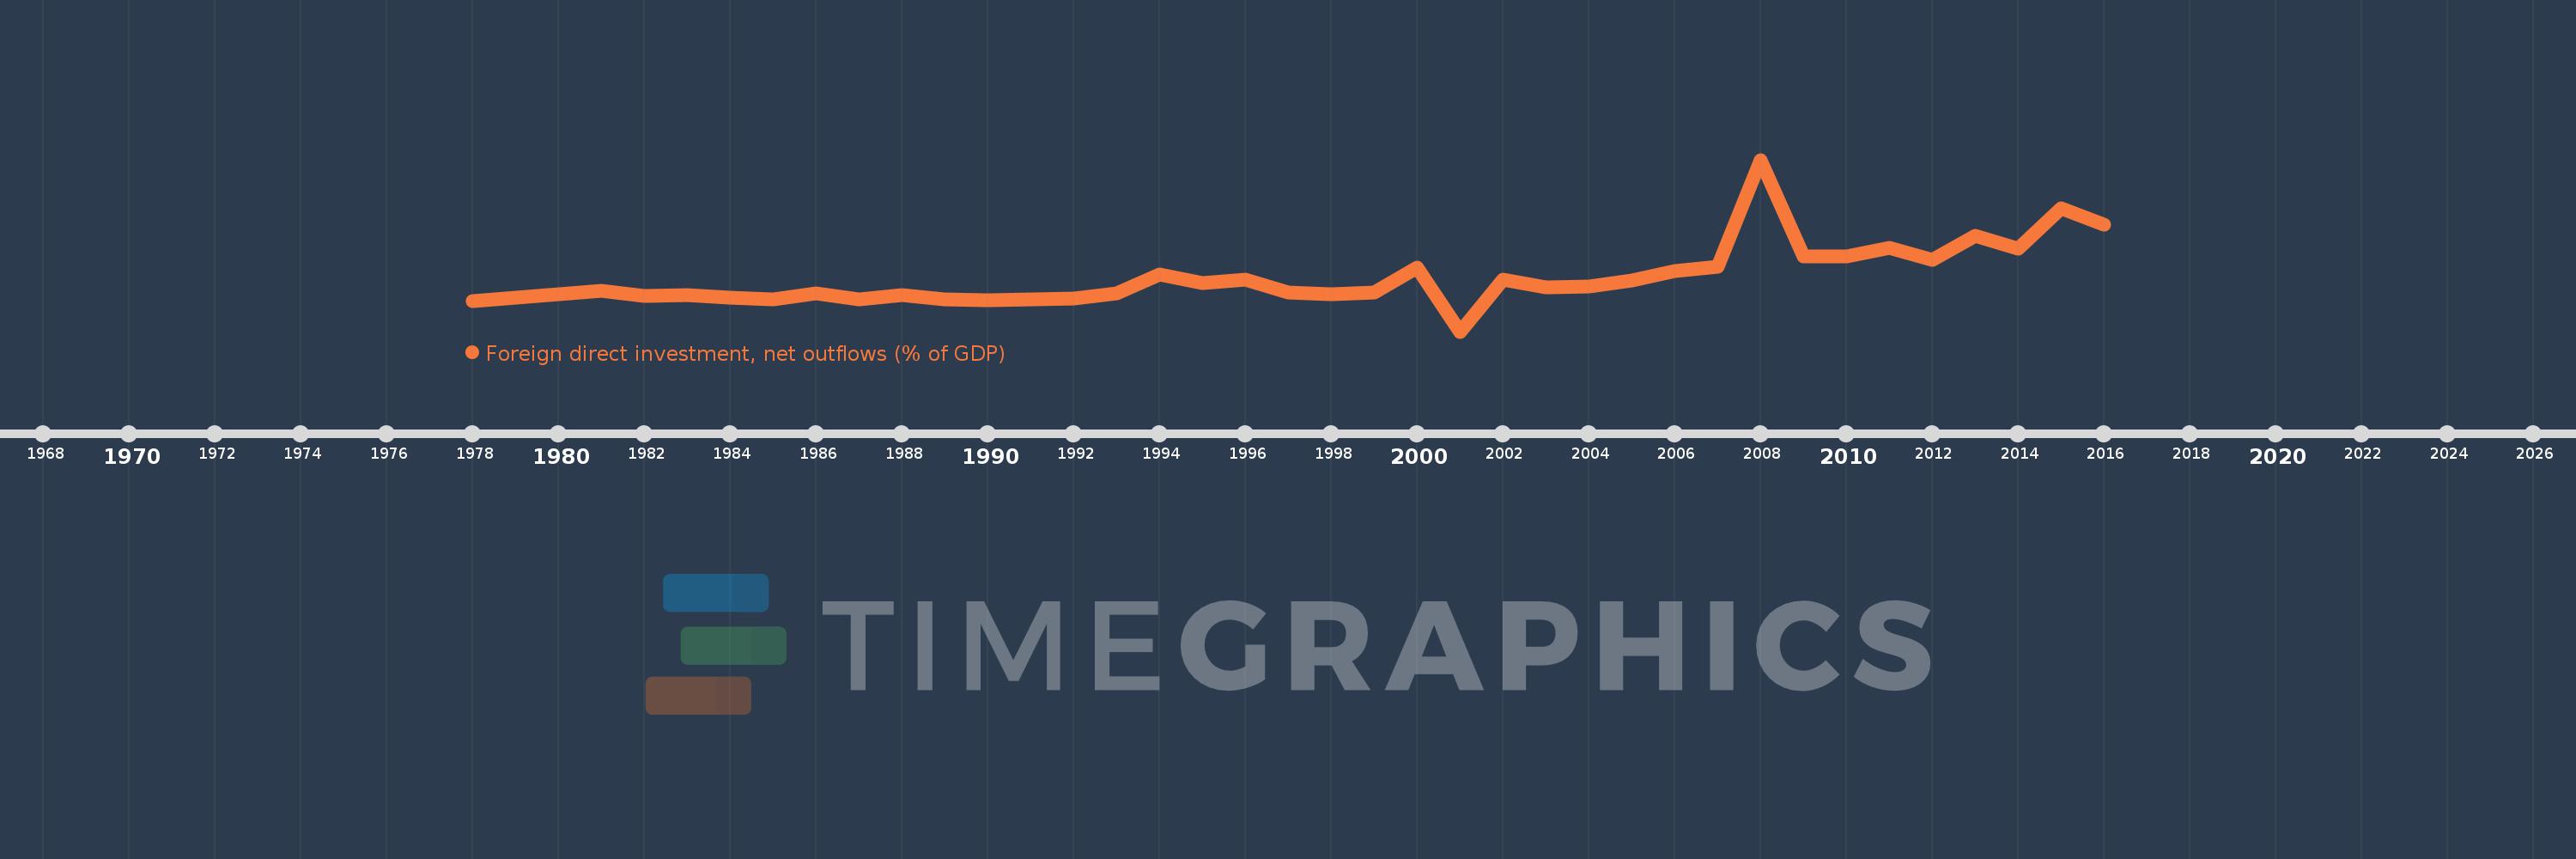
Foreign direct investment, net outflows (% of GDP)
2016,2015,2014,2013,2012,2011,2010,2009,2008,2007,2006,2005,2004,2003,2002,2001,2000,1999,1998,1997,1996,1995,1994,1993,1992,1991,1990,1989,1988,1987,1986,1985,1984,1983,1982,1981,1978
Estas estadísticas en otros países:
AfghanistanAlbaniaAlgeriaAngolaAntigua and BarbudaArab WorldArgentinaArmeniaArubaAustraliaAustriaAzerbaijanBahamas, TheBahrainBangladeshBarbadosBelarusBelgiumBelizeBeninBermudaBoliviaBosnia and HerzegovinaBotswanaBrazilBrunei DarussalamBulgariaBurkina FasoBurundiCabo VerdeCambodiaCameroonCanadaCaribbean small statesCayman IslandsCentral African RepublicCentral Europe and the BalticsChadChileChinaColombiaComorosCongo, Dem. Rep.Congo, Rep.Costa RicaCote d'IvoireCroatiaCyprusCzech RepublicDenmarkDominicaDominican RepublicEarly-demographic dividendEast Asia & PacificEast Asia & Pacific (excluding high income)East Asia & Pacific (IDA & IBRD countries)EcuadorEgypt, Arab Rep.El SalvadorEquatorial GuineaEritreaEstoniaEuro areaEurope & Central AsiaEurope & Central Asia (excluding high income)Europe & Central Asia (IDA & IBRD countries)European UnionFijiFinlandFragile and conflict affected situationsFranceFrench PolynesiaGabonGambia, TheGeorgiaGermanyGhanaGreeceGrenadaGuatemalaGuineaGuinea-BissauGuyanaHaitiHeavily indebted poor countries (HIPC)High incomeHondurasHong Kong SAR, ChinaHungaryIBRD onlyIcelandIDA & IBRD totalIDA blendIDA onlyIDA totalIndiaIndonesiaIran, Islamic Rep.IraqIrelandIsraelItalyJamaicaJapanJordanKazakhstanKenyaKiribatiKorea, Rep.KosovoKuwaitKyrgyz RepublicLao PDRLate-demographic dividendLatin America & Caribbean Latin America & Caribbean (excluding high income)Latin America & the Caribbean (IDA & IBRD countries)LatviaLeast developed countries: UN classificationLebanonLesothoLiberiaLibyaLithuaniaLow & middle incomeLow incomeLower middle incomeLuxembourgMacao SAR, ChinaMacedonia, FYRMadagascarMalawiMalaysiaMaliMaltaMarshall IslandsMauritaniaMauritiusMexicoMicronesia, Fed. Sts.Middle East & North AfricaMiddle East & North Africa (excluding high income)Middle East & North Africa (IDA & IBRD countries)Middle incomeMoldovaMongoliaMontenegroMoroccoMozambiqueNamibiaNauruNetherlandsNew ZealandNicaraguaNigerNigeriaNorth AmericaNorwayOECD membersOmanOther small statesPacific island small statesPakistanPalauPanamaPapua New GuineaParaguayPeruPhilippinesPolandPortugalPost-demographic dividendPre-demographic dividendQatarRomaniaRussian FederationRwandaSamoaSao Tome and PrincipeSaudi ArabiaSenegalSerbiaSeychellesSierra LeoneSingaporeSlovak RepublicSloveniaSmall statesSolomon IslandsSouth AfricaSouth AsiaSouth Asia (IDA & IBRD)SpainSri LankaSt. Kitts and NevisSt. LuciaSt. Vincent and the GrenadinesSub-Saharan Africa Sub-Saharan Africa (excluding high income)Sub-Saharan Africa (IDA & IBRD countries)SurinameSwazilandSwedenSwitzerlandSyrian Arab RepublicTajikistanTanzaniaThailandTimor-LesteTogoTongaTrinidad and TobagoTunisiaTurkeyUgandaUkraineUnited Arab EmiratesUnited KingdomUnited StatesUpper middle incomeUruguayVanuatuVenezuela, RBVietnamWest Bank and GazaWorldYemen, Rep.ZambiaZimbabwe línea de tiempo (timeline):
En esta escala de tiempo se presenta un gráfico de 1978 y 2016 de Philippines. Los datos de 1977 están ausentes. El número de observaciones reales por fecha: 37.
Fuente (nombre):
Indicadores del desarrollo mundial
Fuente (organización):
International Monetary Fund, International Financial Statistics and Balance of Payments databases, World Bank, International Debt Statistics, and World Bank and OECD GDP estimates.
Categorías:
Economy & Growth, Financial Sector
Se ha actualizado:
23 abr 2017 año
Los indicadores de los cambios de valor en los últimos años
Mínimo:
-0.775
1 ene 2001 año
Máximo:
3.597
1 ene 2008 año
A la fecha de observación
Valor
Cambio absoluto
El cambio con respecto al valor anterior
1 ene 1978 año
0.005
+0.005
0.0%
1 ene 1981 año
0.265
+0.26
5.11 mil%
1 ene 1982 año
0.132
-0.133
-50.25%
1 ene 1983 año
0.164
+0.032
24.57%
1 ene 1984 año
0.081
-0.083
-50.5%
1 ene 1985 año
0.048
-0.034
-41.25%
1 ene 1986 año
0.189
+0.141
295.15%
1 ene 1987 año
0.037
-0.152
-80.48%
1 ene 1988 año
0.16
+0.123
333.52%
1 ene 1989 año
0.042
-0.117
-73.55%
1 ene 1990 año
0.021
-0.021
-49.95%
1 ene 1991 año
0.05
+0.029
134.87%
1 ene 1992 año
0.059
+0.01
19.74%
1 ene 1993 año
0.191
+0.131
220.7%
1 ene 1994 año
0.688
+0.497
260.82%
1 ene 1995 año
0.471
-0.217
-31.49%
1 ene 1996 año
0.538
+0.067
14.23%
1 ene 1997 año
0.22
-0.319
-59.19%
1 ene 1998 año
0.165
-0.055
-24.82%
1 ene 1999 año
0.222
+0.056
34.16%
1 ene 2000 año
0.861
+0.64
288.79%
1 ene 2001 año
-0.775
-1.637
-189.97%
1 ene 2002 año
0.557
+1.332
-171.9%
1 ene 2003 año
0.359
-0.198
-35.6%
1 ene 2004 año
0.362
+0.003
0.94%
1 ene 2005 año
0.529
+0.166
45.9%
1 ene 2006 año
0.77
+0.242
45.75%
1 ene 2007 año
0.874
+0.104
13.46%
1 ene 2008 año
3.597
+2.723
311.5%
1 ene 2009 año
1.131
-2.466
-68.56%
1 ene 2010 año
1.127
-0.004
-0.35%
1 ene 2011 año
1.359
+0.232
20.57%
1 ene 2012 año
1.048
-0.311
-22.86%
1 ene 2013 año
1.669
+0.62
59.18%
1 ene 2014 año
1.342
-0.327
-19.6%
1 ene 2015 año
2.371
+1.03
76.74%
1 ene 2016 año
1.949
-0.422
-17.81%
Ranking de los países por los datos estadísticos actuales


Comentarios: