29
/es/
es
AIzaSyAYiBZKx7MnpbEhh9jyipgxe19OcubqV5w
April 1, 2024
245571
South Africa
ZAF
true
2
1
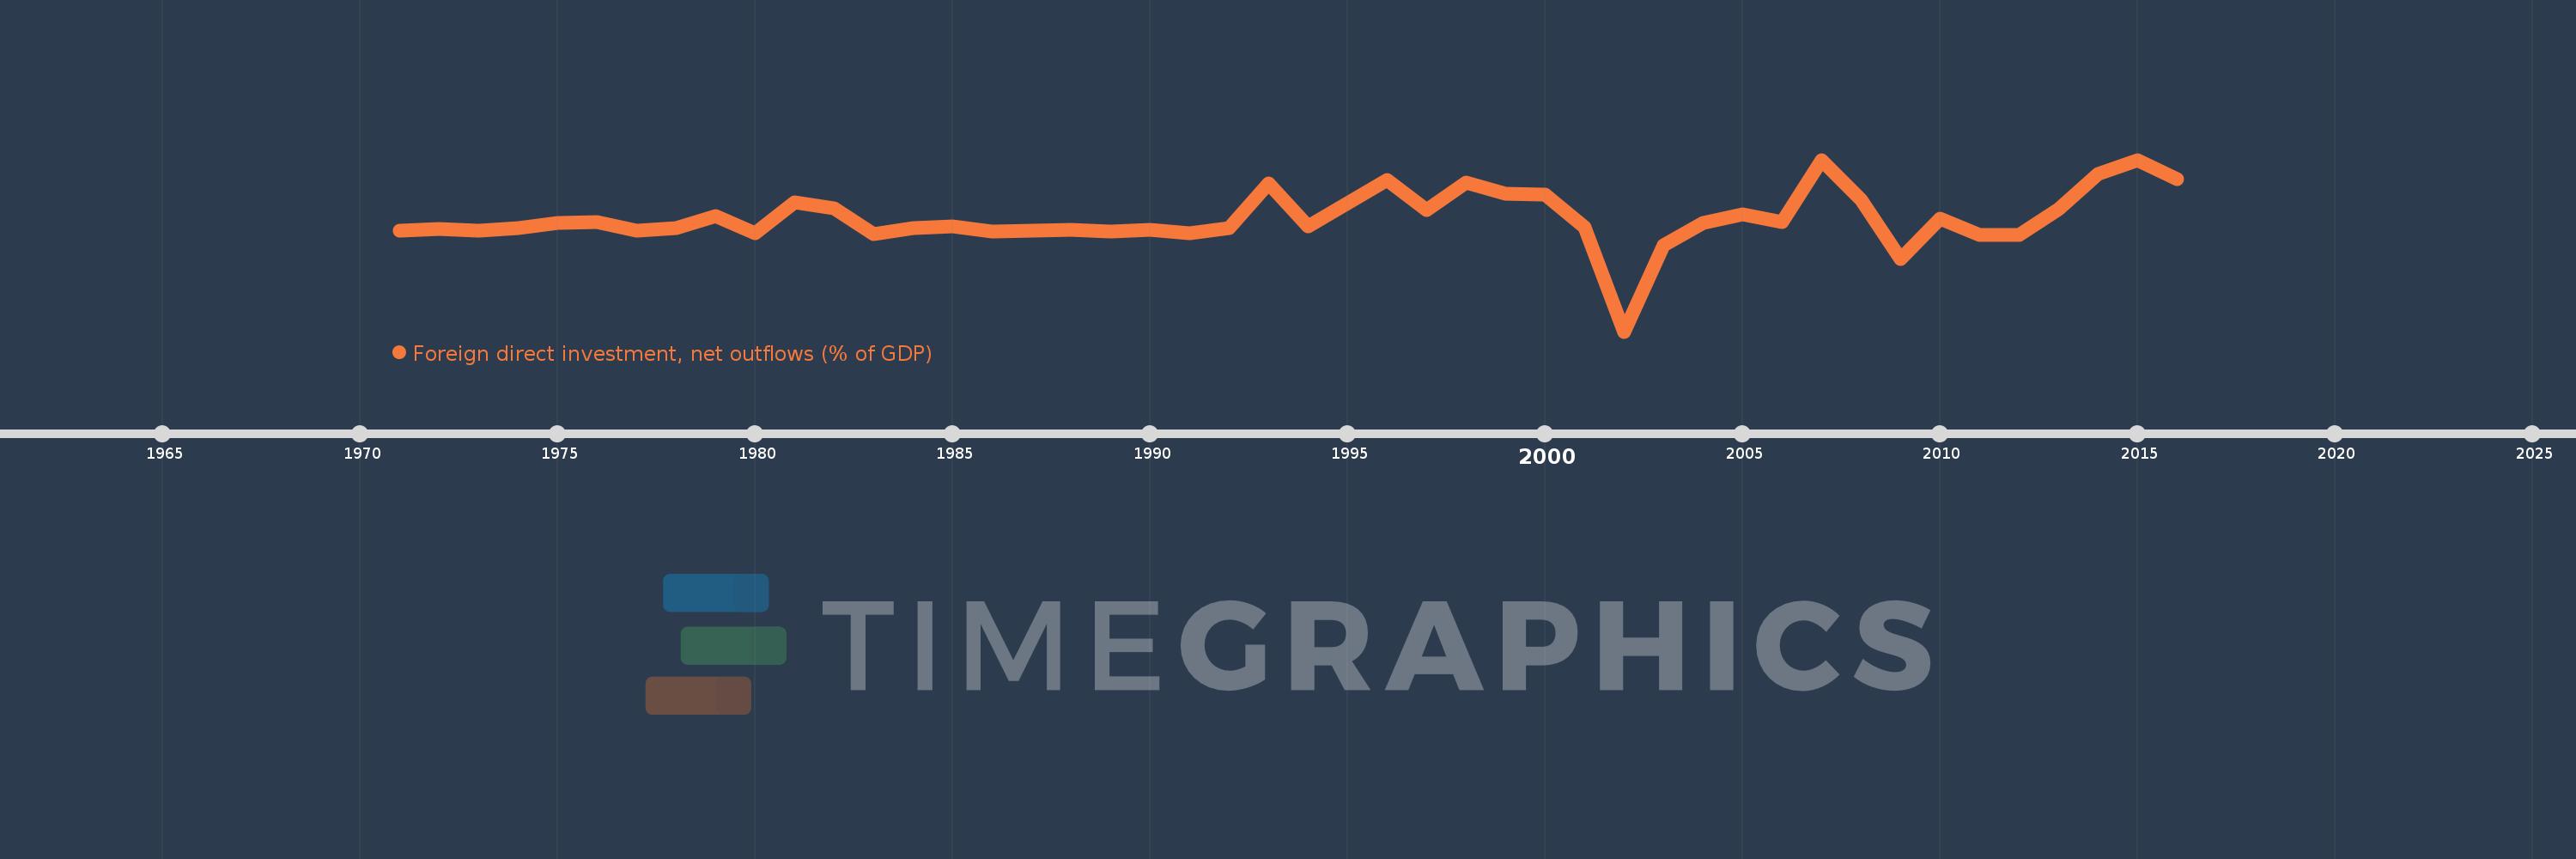
Foreign direct investment, net outflows (% of GDP)
2016,2015,2014,2013,2012,2011,2010,2009,2008,2007,2006,2005,2004,2003,2002,2001,2000,1999,1998,1997,1996,1995,1994,1993,1992,1991,1990,1989,1988,1987,1986,1985,1984,1983,1982,1981,1980,1979,1978,1977,1976,1975,1974,1973,1972,1971
Estas estadísticas en otros países:
AfghanistanAlbaniaAlgeriaAngolaAntigua and BarbudaArab WorldArgentinaArmeniaArubaAustraliaAustriaAzerbaijanBahamas, TheBahrainBangladeshBarbadosBelarusBelgiumBelizeBeninBermudaBoliviaBosnia and HerzegovinaBotswanaBrazilBrunei DarussalamBulgariaBurkina FasoBurundiCabo VerdeCambodiaCameroonCanadaCaribbean small statesCayman IslandsCentral African RepublicCentral Europe and the BalticsChadChileChinaColombiaComorosCongo, Dem. Rep.Congo, Rep.Costa RicaCote d'IvoireCroatiaCyprusCzech RepublicDenmarkDominicaDominican RepublicEarly-demographic dividendEast Asia & PacificEast Asia & Pacific (excluding high income)East Asia & Pacific (IDA & IBRD countries)EcuadorEgypt, Arab Rep.El SalvadorEquatorial GuineaEritreaEstoniaEuro areaEurope & Central AsiaEurope & Central Asia (excluding high income)Europe & Central Asia (IDA & IBRD countries)European UnionFijiFinlandFragile and conflict affected situationsFranceFrench PolynesiaGabonGambia, TheGeorgiaGermanyGhanaGreeceGrenadaGuatemalaGuineaGuinea-BissauGuyanaHaitiHeavily indebted poor countries (HIPC)High incomeHondurasHong Kong SAR, ChinaHungaryIBRD onlyIcelandIDA & IBRD totalIDA blendIDA onlyIDA totalIndiaIndonesiaIran, Islamic Rep.IraqIrelandIsraelItalyJamaicaJapanJordanKazakhstanKenyaKiribatiKorea, Rep.KosovoKuwaitKyrgyz RepublicLao PDRLate-demographic dividendLatin America & Caribbean Latin America & Caribbean (excluding high income)Latin America & the Caribbean (IDA & IBRD countries)LatviaLeast developed countries: UN classificationLebanonLesothoLiberiaLibyaLithuaniaLow & middle incomeLow incomeLower middle incomeLuxembourgMacao SAR, ChinaMacedonia, FYRMadagascarMalawiMalaysiaMaliMaltaMarshall IslandsMauritaniaMauritiusMexicoMicronesia, Fed. Sts.Middle East & North AfricaMiddle East & North Africa (excluding high income)Middle East & North Africa (IDA & IBRD countries)Middle incomeMoldovaMongoliaMontenegroMoroccoMozambiqueNamibiaNauruNetherlandsNew ZealandNicaraguaNigerNigeriaNorth AmericaNorwayOECD membersOmanOther small statesPacific island small statesPakistanPalauPanamaPapua New GuineaParaguayPeruPhilippinesPolandPortugalPost-demographic dividendPre-demographic dividendQatarRomaniaRussian FederationRwandaSamoaSao Tome and PrincipeSaudi ArabiaSenegalSerbiaSeychellesSierra LeoneSingaporeSlovak RepublicSloveniaSmall statesSolomon IslandsSouth AfricaSouth AsiaSouth Asia (IDA & IBRD)SpainSri LankaSt. Kitts and NevisSt. LuciaSt. Vincent and the GrenadinesSub-Saharan Africa Sub-Saharan Africa (excluding high income)Sub-Saharan Africa (IDA & IBRD countries)SurinameSwazilandSwedenSwitzerlandSyrian Arab RepublicTajikistanTanzaniaThailandTimor-LesteTogoTongaTrinidad and TobagoTunisiaTurkeyUgandaUkraineUnited Arab EmiratesUnited KingdomUnited StatesUpper middle incomeUruguayVanuatuVenezuela, RBVietnamWest Bank and GazaWorldYemen, Rep.ZambiaZimbabwe línea de tiempo (timeline):
En esta escala de tiempo se presenta un gráfico de 1971 y 2016 de South Africa. Los datos de 1970 están ausentes. El número de observaciones reales por fecha: 46.
Fuente (nombre):
Indicadores del desarrollo mundial
Fuente (organización):
International Monetary Fund, International Financial Statistics and Balance of Payments databases, World Bank, International Debt Statistics, and World Bank and OECD GDP estimates.
Categorías:
Economy & Growth, Financial Sector
Se ha actualizado:
23 abr 2017 año
Los indicadores de los cambios de valor en los últimos años
Mínimo:
-2.892
1 ene 2002 año
Máximo:
2.19
1 ene 2015 año
A la fecha de observación
Valor
Cambio absoluto
El cambio con respecto al valor anterior
1 ene 1971 año
0.094
+0.094
0.0%
1 ene 1972 año
0.149
+0.055
58.34%
1 ene 1973 año
0.094
-0.055
-36.71%
1 ene 1974 año
0.182
+0.088
93.97%
1 ene 1975 año
0.321
+0.139
76.17%
1 ene 1976 año
0.34
+0.019
5.93%
1 ene 1977 año
0.091
-0.25
-73.33%
1 ene 1978 año
0.172
+0.081
89.72%
1 ene 1979 año
0.525
+0.353
204.96%
1 ene 1980 año
0.019
-0.506
-96.36%
1 ene 1981 año
0.937
+0.918
4.81 mil%
1 ene 1982 año
0.742
-0.196
-20.89%
1 ene 1983 año
-0.007
-0.748
-100.93%
1 ene 1984 año
0.182
+0.188
-2.74 mil%
1 ene 1985 año
0.227
+0.045
24.85%
1 ene 1986 año
0.071
-0.156
-68.86%
1 ene 1987 año
0.089
+0.019
26.43%
1 ene 1988 año
0.108
+0.019
20.73%
1 ene 1989 año
0.056
-0.051
-47.74%
1 ene 1990 año
0.13
+0.074
131.26%
1 ene 1991 año
0.025
-0.105
-80.83%
1 ene 1992 año
0.172
+0.147
587.56%
1 ene 1993 año
1.486
+1.314
765.24%
1 ene 1994 año
0.217
-1.268
-85.37%
1 ene 1995 año
0.902
+0.685
314.99%
1 ene 1996 año
1.604
+0.702
77.86%
1 ene 1997 año
0.71
-0.894
-55.74%
1 ene 1998 año
1.523
+0.813
114.49%
1 ene 1999 año
1.186
-0.337
-22.12%
1 ene 2000 año
1.159
-0.027
-2.24%
1 ene 2001 año
0.203
-0.956
-82.47%
1 ene 2002 año
-2.892
-3.096
-1.52 mil%
1 ene 2003 año
-0.348
+2.544
-87.96%
1 ene 2004 año
0.315
+0.664
-190.51%
1 ene 2005 año
0.571
+0.256
81.13%
1 ene 2006 año
0.353
-0.218
-38.22%
1 ene 2007 año
2.183
+1.83
518.66%
1 ene 2008 año
0.996
-1.187
-54.37%
1 ene 2009 año
-0.739
-1.735
-174.21%
1 ene 2010 año
0.443
+1.182
-159.95%
1 ene 2011 año
-0.043
-0.486
-109.7%
1 ene 2012 año
-0.037
+0.006
-14.27%
1 ene 2013 año
0.731
+0.768
-2.09 mil%
1 ene 2014 año
1.774
+1.042
142.5%
1 ene 2015 año
2.19
+0.416
23.45%
1 ene 2016 año
1.63
-0.56
-25.56%
Ranking de los países por los datos estadísticos actuales


Comentarios: