29
/es/
es
AIzaSyAYiBZKx7MnpbEhh9jyipgxe19OcubqV5w
April 1, 2024
225884
Portugal
PRT
true
2
1
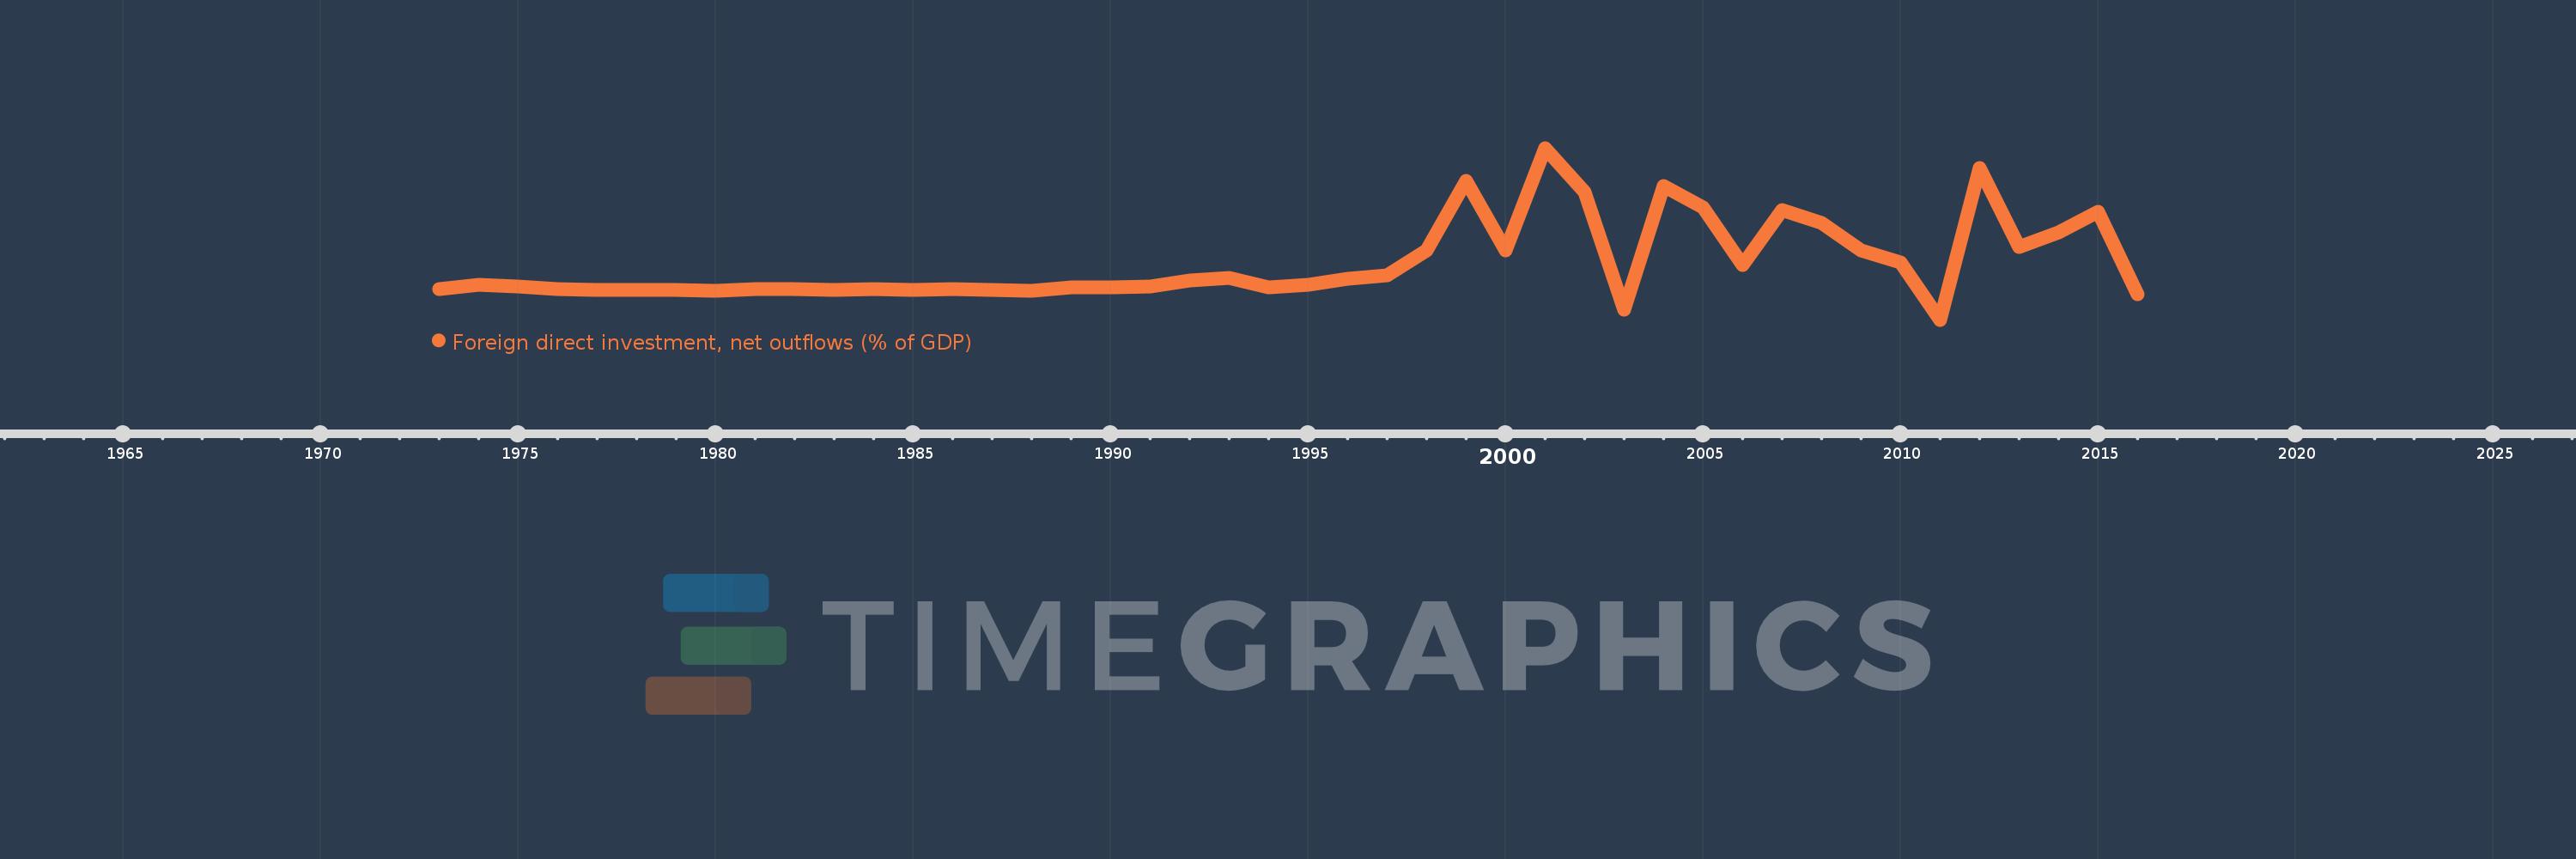
Foreign direct investment, net outflows (% of GDP)
2016,2015,2014,2013,2012,2011,2010,2009,2008,2007,2006,2005,2004,2003,2002,2001,2000,1999,1998,1997,1996,1995,1994,1993,1992,1991,1990,1989,1988,1987,1986,1985,1984,1983,1982,1981,1980,1979,1978,1977,1976,1975,1974,1973
Estas estadísticas en otros países:
AfghanistanAlbaniaAlgeriaAngolaAntigua and BarbudaArab WorldArgentinaArmeniaArubaAustraliaAustriaAzerbaijanBahamas, TheBahrainBangladeshBarbadosBelarusBelgiumBelizeBeninBermudaBoliviaBosnia and HerzegovinaBotswanaBrazilBrunei DarussalamBulgariaBurkina FasoBurundiCabo VerdeCambodiaCameroonCanadaCaribbean small statesCayman IslandsCentral African RepublicCentral Europe and the BalticsChadChileChinaColombiaComorosCongo, Dem. Rep.Congo, Rep.Costa RicaCote d'IvoireCroatiaCyprusCzech RepublicDenmarkDominicaDominican RepublicEarly-demographic dividendEast Asia & PacificEast Asia & Pacific (excluding high income)East Asia & Pacific (IDA & IBRD countries)EcuadorEgypt, Arab Rep.El SalvadorEquatorial GuineaEritreaEstoniaEuro areaEurope & Central AsiaEurope & Central Asia (excluding high income)Europe & Central Asia (IDA & IBRD countries)European UnionFijiFinlandFragile and conflict affected situationsFranceFrench PolynesiaGabonGambia, TheGeorgiaGermanyGhanaGreeceGrenadaGuatemalaGuineaGuinea-BissauGuyanaHaitiHeavily indebted poor countries (HIPC)High incomeHondurasHong Kong SAR, ChinaHungaryIBRD onlyIcelandIDA & IBRD totalIDA blendIDA onlyIDA totalIndiaIndonesiaIran, Islamic Rep.IraqIrelandIsraelItalyJamaicaJapanJordanKazakhstanKenyaKiribatiKorea, Rep.KosovoKuwaitKyrgyz RepublicLao PDRLate-demographic dividendLatin America & Caribbean Latin America & Caribbean (excluding high income)Latin America & the Caribbean (IDA & IBRD countries)LatviaLeast developed countries: UN classificationLebanonLesothoLiberiaLibyaLithuaniaLow & middle incomeLow incomeLower middle incomeLuxembourgMacao SAR, ChinaMacedonia, FYRMadagascarMalawiMalaysiaMaliMaltaMarshall IslandsMauritaniaMauritiusMexicoMicronesia, Fed. Sts.Middle East & North AfricaMiddle East & North Africa (excluding high income)Middle East & North Africa (IDA & IBRD countries)Middle incomeMoldovaMongoliaMontenegroMoroccoMozambiqueNamibiaNauruNetherlandsNew ZealandNicaraguaNigerNigeriaNorth AmericaNorwayOECD membersOmanOther small statesPacific island small statesPakistanPalauPanamaPapua New GuineaParaguayPeruPhilippinesPolandPortugalPost-demographic dividendPre-demographic dividendQatarRomaniaRussian FederationRwandaSamoaSao Tome and PrincipeSaudi ArabiaSenegalSerbiaSeychellesSierra LeoneSingaporeSlovak RepublicSloveniaSmall statesSolomon IslandsSouth AfricaSouth AsiaSouth Asia (IDA & IBRD)SpainSri LankaSt. Kitts and NevisSt. LuciaSt. Vincent and the GrenadinesSub-Saharan Africa Sub-Saharan Africa (excluding high income)Sub-Saharan Africa (IDA & IBRD countries)SurinameSwazilandSwedenSwitzerlandSyrian Arab RepublicTajikistanTanzaniaThailandTimor-LesteTogoTongaTrinidad and TobagoTunisiaTurkeyUgandaUkraineUnited Arab EmiratesUnited KingdomUnited StatesUpper middle incomeUruguayVanuatuVenezuela, RBVietnamWest Bank and GazaWorldYemen, Rep.ZambiaZimbabwe línea de tiempo (timeline):
En esta escala de tiempo se presenta un gráfico de 1973 y 2016 de Portugal. Los datos de 1972 están ausentes. El número de observaciones reales por fecha: 44.
Fuente (nombre):
Indicadores del desarrollo mundial
Fuente (organización):
International Monetary Fund, International Financial Statistics and Balance of Payments databases, World Bank, International Debt Statistics, and World Bank and OECD GDP estimates.
Categorías:
Economy & Growth, Financial Sector
Se ha actualizado:
23 abr 2017 año
Los indicadores de los cambios de valor en los últimos años
Mínimo:
-1.543
1 ene 2011 año
Máximo:
7.43
1 ene 2001 año
A la fecha de observación
Valor
Cambio absoluto
El cambio con respecto al valor anterior
1 ene 1973 año
0.062
+0.062
0.0%
1 ene 1974 año
0.292
+0.229
368.15%
1 ene 1975 año
0.211
-0.08
-27.54%
1 ene 1976 año
0.042
-0.169
-80.2%
1 ene 1977 año
0.025
-0.017
-39.69%
1 ene 1978 año
0.012
-0.013
-51.08%
1 ene 1979 año
0.026
+0.014
109.68%
1 ene 1980 año
-0.03
-0.056
-216.89%
1 ene 1981 año
0.042
+0.072
-237.51%
1 ene 1982 año
0.051
+0.01
23.69%
1 ene 1983 año
0.028
-0.024
-45.92%
1 ene 1984 año
0.067
+0.039
140.62%
1 ene 1985 año
0.035
-0.032
-47.44%
1 ene 1986 año
0.08
+0.045
127.21%
1 ene 1987 año
-0.001
-0.081
-100.82%
1 ene 1988 año
-0.021
-0.02
3.11 mil%
1 ene 1989 año
0.142
+0.163
-769.47%
1 ene 1990 año
0.139
-0.002
-1.73%
1 ene 1991 año
0.207
+0.068
48.9%
1 ene 1992 año
0.519
+0.312
150.73%
1 ene 1993 año
0.639
+0.12
23.04%
1 ene 1994 año
0.155
-0.484
-75.73%
1 ene 1995 año
0.288
+0.133
85.58%
1 ene 1996 año
0.583
+0.295
102.49%
1 ene 1997 año
0.776
+0.193
33.16%
1 ene 1998 año
2.075
+1.299
167.45%
1 ene 1999 año
5.732
+3.657
176.24%
1 ene 2000 año
2.068
-3.664
-63.92%
1 ene 2001 año
7.43
+5.362
259.28%
1 ene 2002 año
5.124
-2.306
-31.04%
1 ene 2003 año
-1.03
-6.154
-120.11%
1 ene 2004 año
5.464
+6.494
-630.4%
1 ene 2005 año
4.34
-1.124
-20.57%
1 ene 2006 año
1.329
-3.012
-69.39%
1 ene 2007 año
4.206
+2.877
216.56%
1 ene 2008 año
3.531
-0.675
-16.06%
1 ene 2009 año
2.079
-1.451
-41.1%
1 ene 2010 año
1.459
-0.62
-29.84%
1 ene 2011 año
-1.543
-3.002
-205.74%
1 ene 2012 año
6.386
+7.929
-513.9%
1 ene 2013 año
2.272
-4.114
-64.43%
1 ene 2014 año
3.039
+0.768
33.79%
1 ene 2015 año
4.105
+1.065
35.06%
1 ene 2016 año
-0.206
-4.311
-105.02%
Ranking de los países por los datos estadísticos actuales


Comentarios: