29
/es/
es
AIzaSyAYiBZKx7MnpbEhh9jyipgxe19OcubqV5w
April 1, 2024
87305
Bolivia
BOL
true
2
1
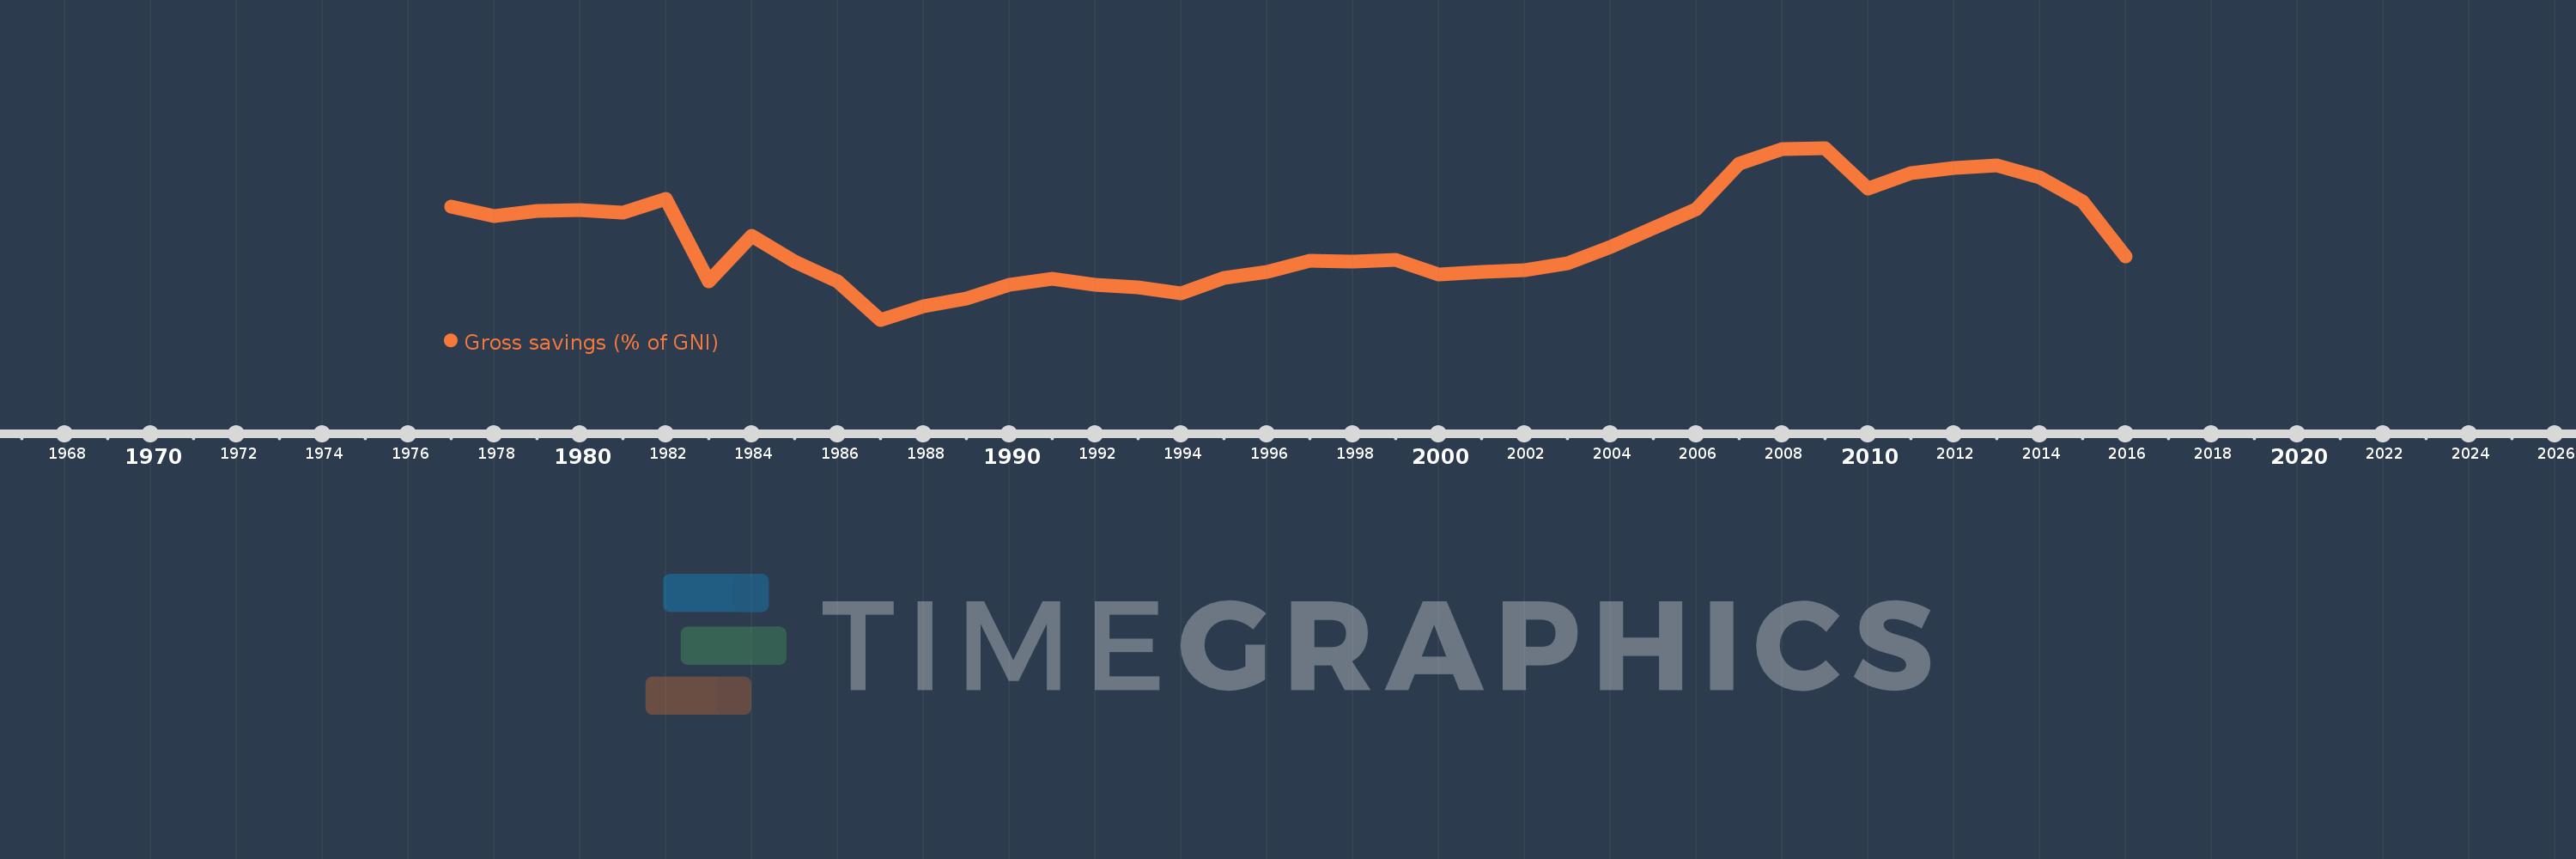
Gross savings (% of GNI)
2016,2015,2014,2013,2012,2011,2010,2009,2008,2007,2006,2005,2004,2003,2002,2001,2000,1999,1998,1997,1996,1995,1994,1993,1992,1991,1990,1989,1988,1987,1986,1985,1984,1983,1982,1981,1980,1979,1978,1977
Estas estadísticas en otros países:
AfghanistanAlbaniaAlgeriaAngolaAntigua and BarbudaArab WorldArgentinaArmeniaAustraliaAustriaAzerbaijanBahamas, TheBahrainBangladeshBarbadosBelarusBelgiumBelizeBeninBermudaBhutanBoliviaBosnia and HerzegovinaBotswanaBrazilBrunei DarussalamBulgariaBurkina FasoBurundiCabo VerdeCambodiaCameroonCanadaCaribbean small statesCentral African RepublicCentral Europe and the BalticsChadChileChinaColombiaComorosCongo, Dem. Rep.Congo, Rep.Costa RicaCote d'IvoireCroatiaCyprusCzech RepublicDenmarkDjiboutiDominicaDominican RepublicEarly-demographic dividendEast Asia & PacificEast Asia & Pacific (excluding high income)East Asia & Pacific (IDA & IBRD countries)EcuadorEgypt, Arab Rep.El SalvadorEquatorial GuineaEritreaEstoniaEthiopiaEuro areaEurope & Central AsiaEurope & Central Asia (excluding high income)Europe & Central Asia (IDA & IBRD countries)European UnionFaroe IslandsFijiFinlandFragile and conflict affected situationsFranceGabonGambia, TheGeorgiaGermanyGhanaGreeceGrenadaGuatemalaGuineaGuinea-BissauGuyanaHaitiHeavily indebted poor countries (HIPC)High incomeHondurasHong Kong SAR, ChinaHungaryIBRD onlyIcelandIDA & IBRD totalIDA blendIDA onlyIDA totalIndiaIndonesiaIran, Islamic Rep.IraqIrelandIsraelItalyJamaicaJapanJordanKazakhstanKenyaKiribatiKorea, Rep.KosovoKuwaitKyrgyz RepublicLao PDRLate-demographic dividendLatin America & Caribbean Latin America & Caribbean (excluding high income)Latin America & the Caribbean (IDA & IBRD countries)LatviaLeast developed countries: UN classificationLebanonLesothoLiberiaLibyaLithuaniaLow & middle incomeLow incomeLower middle incomeLuxembourgMacao SAR, ChinaMacedonia, FYRMadagascarMalawiMalaysiaMaldivesMaliMaltaMauritaniaMauritiusMexicoMiddle East & North AfricaMiddle East & North Africa (excluding high income)Middle East & North Africa (IDA & IBRD countries)Middle incomeMoldovaMongoliaMontenegroMoroccoMozambiqueNamibiaNepalNetherlandsNew ZealandNicaraguaNigerNigeriaNorth AmericaNorwayOECD membersOmanOther small statesPacific island small statesPakistanPanamaPapua New GuineaParaguayPeruPhilippinesPolandPortugalPost-demographic dividendPre-demographic dividendQatarRomaniaRussian FederationRwandaSaudi ArabiaSenegalSerbiaSeychellesSierra LeoneSingaporeSlovak RepublicSloveniaSmall statesSolomon IslandsSouth AfricaSouth AsiaSouth Asia (IDA & IBRD)South SudanSpainSri LankaSt. Kitts and NevisSt. LuciaSt. Vincent and the GrenadinesSub-Saharan Africa Sub-Saharan Africa (excluding high income)Sub-Saharan Africa (IDA & IBRD countries)SudanSurinameSwazilandSwedenSwitzerlandSyrian Arab RepublicTajikistanTanzaniaThailandTimor-LesteTogoTongaTrinidad and TobagoTunisiaTurkeyUgandaUkraineUnited KingdomUnited StatesUpper middle incomeUruguayVanuatuVenezuela, RBVietnamWest Bank and GazaWorldYemen, Rep.ZambiaZimbabwe línea de tiempo (timeline):
En esta escala de tiempo se presenta un gráfico de 1977 y 2016 de Bolivia. Los datos de 1976 están ausentes. El número de observaciones reales por fecha: 40.
Fuente (nombre):
Indicadores del desarrollo mundial
Fuente (organización):
World Bank national accounts data, and OECD National Accounts data files.
Categorías:
Economy & Growth
Se ha actualizado:
23 abr 2017 año
Los indicadores de los cambios de valor en los últimos años
Mínimo:
4.108
1 ene 1987 año
Máximo:
29.946
1 ene 2009 año
A la fecha de observación
Valor
Cambio absoluto
El cambio con respecto al valor anterior
1 ene 1977 año
21.097
+21.097
0.0%
1 ene 1978 año
19.7
-1.397
-6.62%
1 ene 1979 año
20.537
+0.837
4.25%
1 ene 1980 año
20.58
+0.043
0.21%
1 ene 1981 año
20.265
-0.315
-1.53%
1 ene 1982 año
22.345
+2.08
10.26%
1 ene 1983 año
9.944
-12.401
-55.5%
1 ene 1984 año
16.727
+6.782
68.21%
1 ene 1985 año
12.817
-3.909
-23.37%
1 ene 1986 año
9.909
-2.908
-22.69%
1 ene 1987 año
4.108
-5.801
-58.55%
1 ene 1988 año
6.129
+2.022
49.22%
1 ene 1989 año
7.31
+1.181
19.27%
1 ene 1990 año
9.314
+2.004
27.41%
1 ene 1991 año
10.206
+0.891
9.57%
1 ene 1992 año
9.395
-0.811
-7.94%
1 ene 1993 año
8.917
-0.478
-5.09%
1 ene 1994 año
8.111
-0.806
-9.04%
1 ene 1995 año
10.439
+2.328
28.7%
1 ene 1996 año
11.324
+0.886
8.48%
1 ene 1997 año
12.95
+1.626
14.36%
1 ene 1998 año
12.905
-0.045
-0.35%
1 ene 1999 año
13.072
+0.166
1.29%
1 ene 2000 año
10.917
-2.155
-16.48%
1 ene 2001 año
11.32
+0.402
3.69%
1 ene 2002 año
11.556
+0.236
2.09%
1 ene 2003 año
12.623
+1.067
9.24%
1 ene 2004 año
15.049
+2.425
19.21%
1 ene 2005 año
17.828
+2.78
18.47%
1 ene 2006 año
20.698
+2.87
16.1%
1 ene 2007 año
27.537
+6.839
33.04%
1 ene 2008 año
29.745
+2.208
8.02%
1 ene 2009 año
29.946
+0.201
0.68%
1 ene 2010 año
23.826
-6.12
-20.44%
1 ene 2011 año
26.123
+2.298
9.64%
1 ene 2012 año
26.89
+0.766
2.93%
1 ene 2013 año
27.338
+0.449
1.67%
1 ene 2014 año
25.476
-1.862
-6.81%
1 ene 2015 año
21.905
-3.571
-14.02%
1 ene 2016 año
13.647
-8.258
-37.7%
Ranking de los países por los datos estadísticos actuales


Comentarios: