29
/es/
es
AIzaSyAYiBZKx7MnpbEhh9jyipgxe19OcubqV5w
April 1, 2024
124875
Egypt, Arab Rep.
EGY
true
2
1
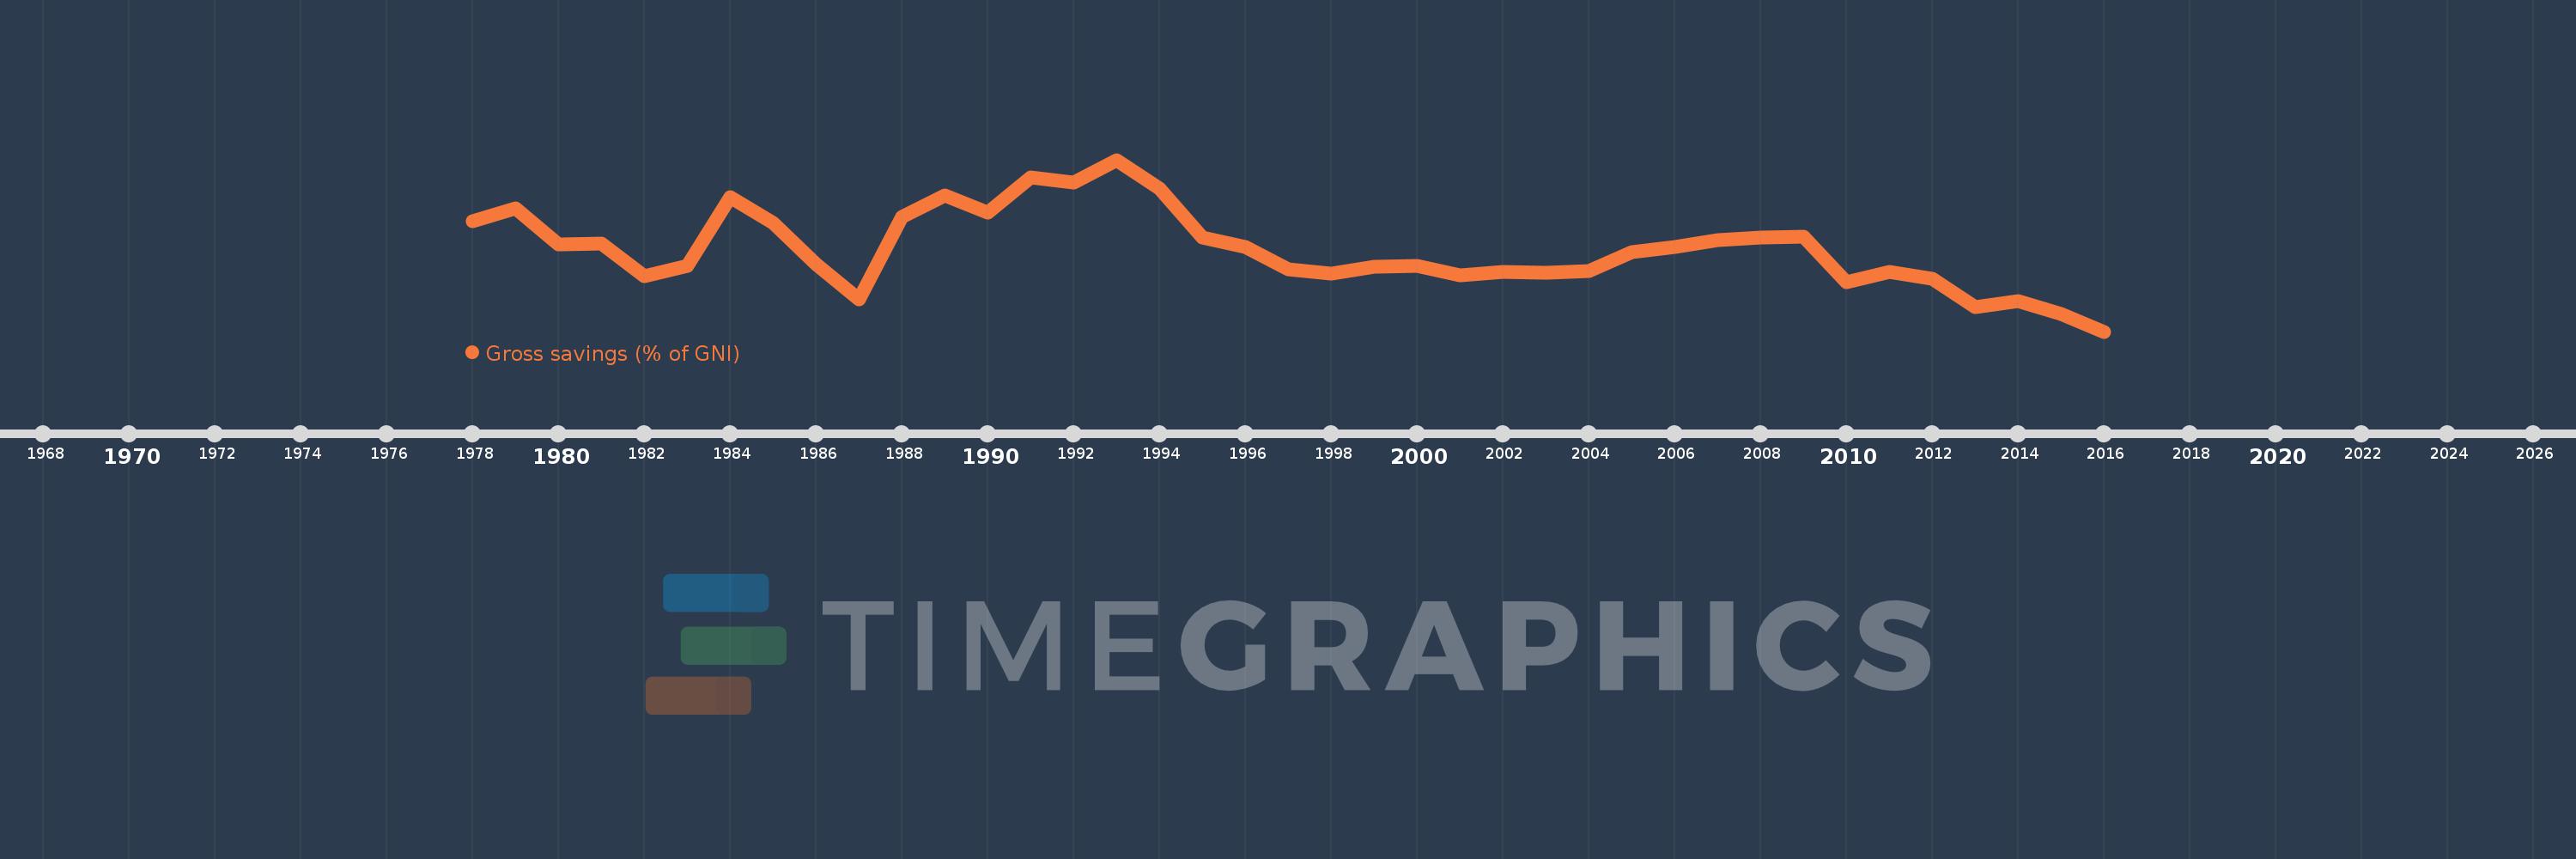
Gross savings (% of GNI)
2016,2015,2014,2013,2012,2011,2010,2009,2008,2007,2006,2005,2004,2003,2002,2001,2000,1999,1998,1997,1996,1995,1994,1993,1992,1991,1990,1989,1988,1987,1986,1985,1984,1983,1982,1981,1980,1979,1978
Estas estadísticas en otros países:
AfghanistanAlbaniaAlgeriaAngolaAntigua and BarbudaArab WorldArgentinaArmeniaAustraliaAustriaAzerbaijanBahamas, TheBahrainBangladeshBarbadosBelarusBelgiumBelizeBeninBermudaBhutanBoliviaBosnia and HerzegovinaBotswanaBrazilBrunei DarussalamBulgariaBurkina FasoBurundiCabo VerdeCambodiaCameroonCanadaCaribbean small statesCentral African RepublicCentral Europe and the BalticsChadChileChinaColombiaComorosCongo, Dem. Rep.Congo, Rep.Costa RicaCote d'IvoireCroatiaCyprusCzech RepublicDenmarkDjiboutiDominicaDominican RepublicEarly-demographic dividendEast Asia & PacificEast Asia & Pacific (excluding high income)East Asia & Pacific (IDA & IBRD countries)EcuadorEgypt, Arab Rep.El SalvadorEquatorial GuineaEritreaEstoniaEthiopiaEuro areaEurope & Central AsiaEurope & Central Asia (excluding high income)Europe & Central Asia (IDA & IBRD countries)European UnionFaroe IslandsFijiFinlandFragile and conflict affected situationsFranceGabonGambia, TheGeorgiaGermanyGhanaGreeceGrenadaGuatemalaGuineaGuinea-BissauGuyanaHaitiHeavily indebted poor countries (HIPC)High incomeHondurasHong Kong SAR, ChinaHungaryIBRD onlyIcelandIDA & IBRD totalIDA blendIDA onlyIDA totalIndiaIndonesiaIran, Islamic Rep.IraqIrelandIsraelItalyJamaicaJapanJordanKazakhstanKenyaKiribatiKorea, Rep.KosovoKuwaitKyrgyz RepublicLao PDRLate-demographic dividendLatin America & Caribbean Latin America & Caribbean (excluding high income)Latin America & the Caribbean (IDA & IBRD countries)LatviaLeast developed countries: UN classificationLebanonLesothoLiberiaLibyaLithuaniaLow & middle incomeLow incomeLower middle incomeLuxembourgMacao SAR, ChinaMacedonia, FYRMadagascarMalawiMalaysiaMaldivesMaliMaltaMauritaniaMauritiusMexicoMiddle East & North AfricaMiddle East & North Africa (excluding high income)Middle East & North Africa (IDA & IBRD countries)Middle incomeMoldovaMongoliaMontenegroMoroccoMozambiqueNamibiaNepalNetherlandsNew ZealandNicaraguaNigerNigeriaNorth AmericaNorwayOECD membersOmanOther small statesPacific island small statesPakistanPanamaPapua New GuineaParaguayPeruPhilippinesPolandPortugalPost-demographic dividendPre-demographic dividendQatarRomaniaRussian FederationRwandaSaudi ArabiaSenegalSerbiaSeychellesSierra LeoneSingaporeSlovak RepublicSloveniaSmall statesSolomon IslandsSouth AfricaSouth AsiaSouth Asia (IDA & IBRD)South SudanSpainSri LankaSt. Kitts and NevisSt. LuciaSt. Vincent and the GrenadinesSub-Saharan Africa Sub-Saharan Africa (excluding high income)Sub-Saharan Africa (IDA & IBRD countries)SudanSurinameSwazilandSwedenSwitzerlandSyrian Arab RepublicTajikistanTanzaniaThailandTimor-LesteTogoTongaTrinidad and TobagoTunisiaTurkeyUgandaUkraineUnited KingdomUnited StatesUpper middle incomeUruguayVanuatuVenezuela, RBVietnamWest Bank and GazaWorldYemen, Rep.ZambiaZimbabwe línea de tiempo (timeline):
En esta escala de tiempo se presenta un gráfico de 1978 y 2016 de Egypt, Arab Rep.. Los datos de 1977 están ausentes. El número de observaciones reales por fecha: 39.
Fuente (nombre):
Indicadores del desarrollo mundial
Fuente (organización):
World Bank national accounts data, and OECD National Accounts data files.
Categorías:
Economy & Growth
Se ha actualizado:
23 abr 2017 año
Los indicadores de los cambios de valor en los últimos años
Mínimo:
9.777
1 ene 2016 año
Máximo:
34.457
1 ene 1993 año
A la fecha de observación
Valor
Cambio absoluto
El cambio con respecto al valor anterior
1 ene 1978 año
25.691
+25.691
0.0%
1 ene 1979 año
27.424
+1.734
6.75%
1 ene 1980 año
22.362
-5.063
-18.46%
1 ene 1981 año
22.411
+0.049
0.22%
1 ene 1982 año
17.759
-4.652
-20.76%
1 ene 1983 año
19.243
+1.484
8.36%
1 ene 1984 año
29.06
+9.817
51.01%
1 ene 1985 año
25.329
-3.732
-12.84%
1 ene 1986 año
19.487
-5.842
-23.06%
1 ene 1987 año
14.423
-5.063
-25.98%
1 ene 1988 año
26.269
+11.845
82.13%
1 ene 1989 año
29.335
+3.066
11.67%
1 ene 1990 año
26.902
-2.433
-8.29%
1 ene 1991 año
31.894
+4.992
18.56%
1 ene 1992 año
31.178
-0.717
-2.25%
1 ene 1993 año
34.457
+3.279
10.52%
1 ene 1994 año
30.291
-4.166
-12.09%
1 ene 1995 año
23.331
-6.96
-22.98%
1 ene 1996 año
21.883
-1.448
-6.2%
1 ene 1997 año
18.753
-3.13
-14.3%
1 ene 1998 año
18.095
-0.658
-3.51%
1 ene 1999 año
19.107
+1.012
5.59%
1 ene 2000 año
19.226
+0.119
0.62%
1 ene 2001 año
17.883
-1.343
-6.99%
1 ene 2002 año
18.359
+0.476
2.66%
1 ene 2003 año
18.242
-0.117
-0.64%
1 ene 2004 año
18.534
+0.292
1.6%
1 ene 2005 año
21.156
+2.622
14.15%
1 ene 2006 año
21.899
+0.743
3.51%
1 ene 2007 año
22.861
+0.962
4.39%
1 ene 2008 año
23.343
+0.482
2.11%
1 ene 2009 año
23.428
+0.085
0.36%
1 ene 2010 año
16.83
-6.598
-28.16%
1 ene 2011 año
18.318
+1.488
8.84%
1 ene 2012 año
17.312
-1.006
-5.49%
1 ene 2013 año
13.327
-3.985
-23.02%
1 ene 2014 año
14.17
+0.844
6.33%
1 ene 2015 año
12.333
-1.838
-12.97%
1 ene 2016 año
9.777
-2.555
-20.72%
Ranking de los países por los datos estadísticos actuales


Comentarios: