29
/es/
es
AIzaSyAYiBZKx7MnpbEhh9jyipgxe19OcubqV5w
April 1, 2024
106056
China
CHN
true
2
1
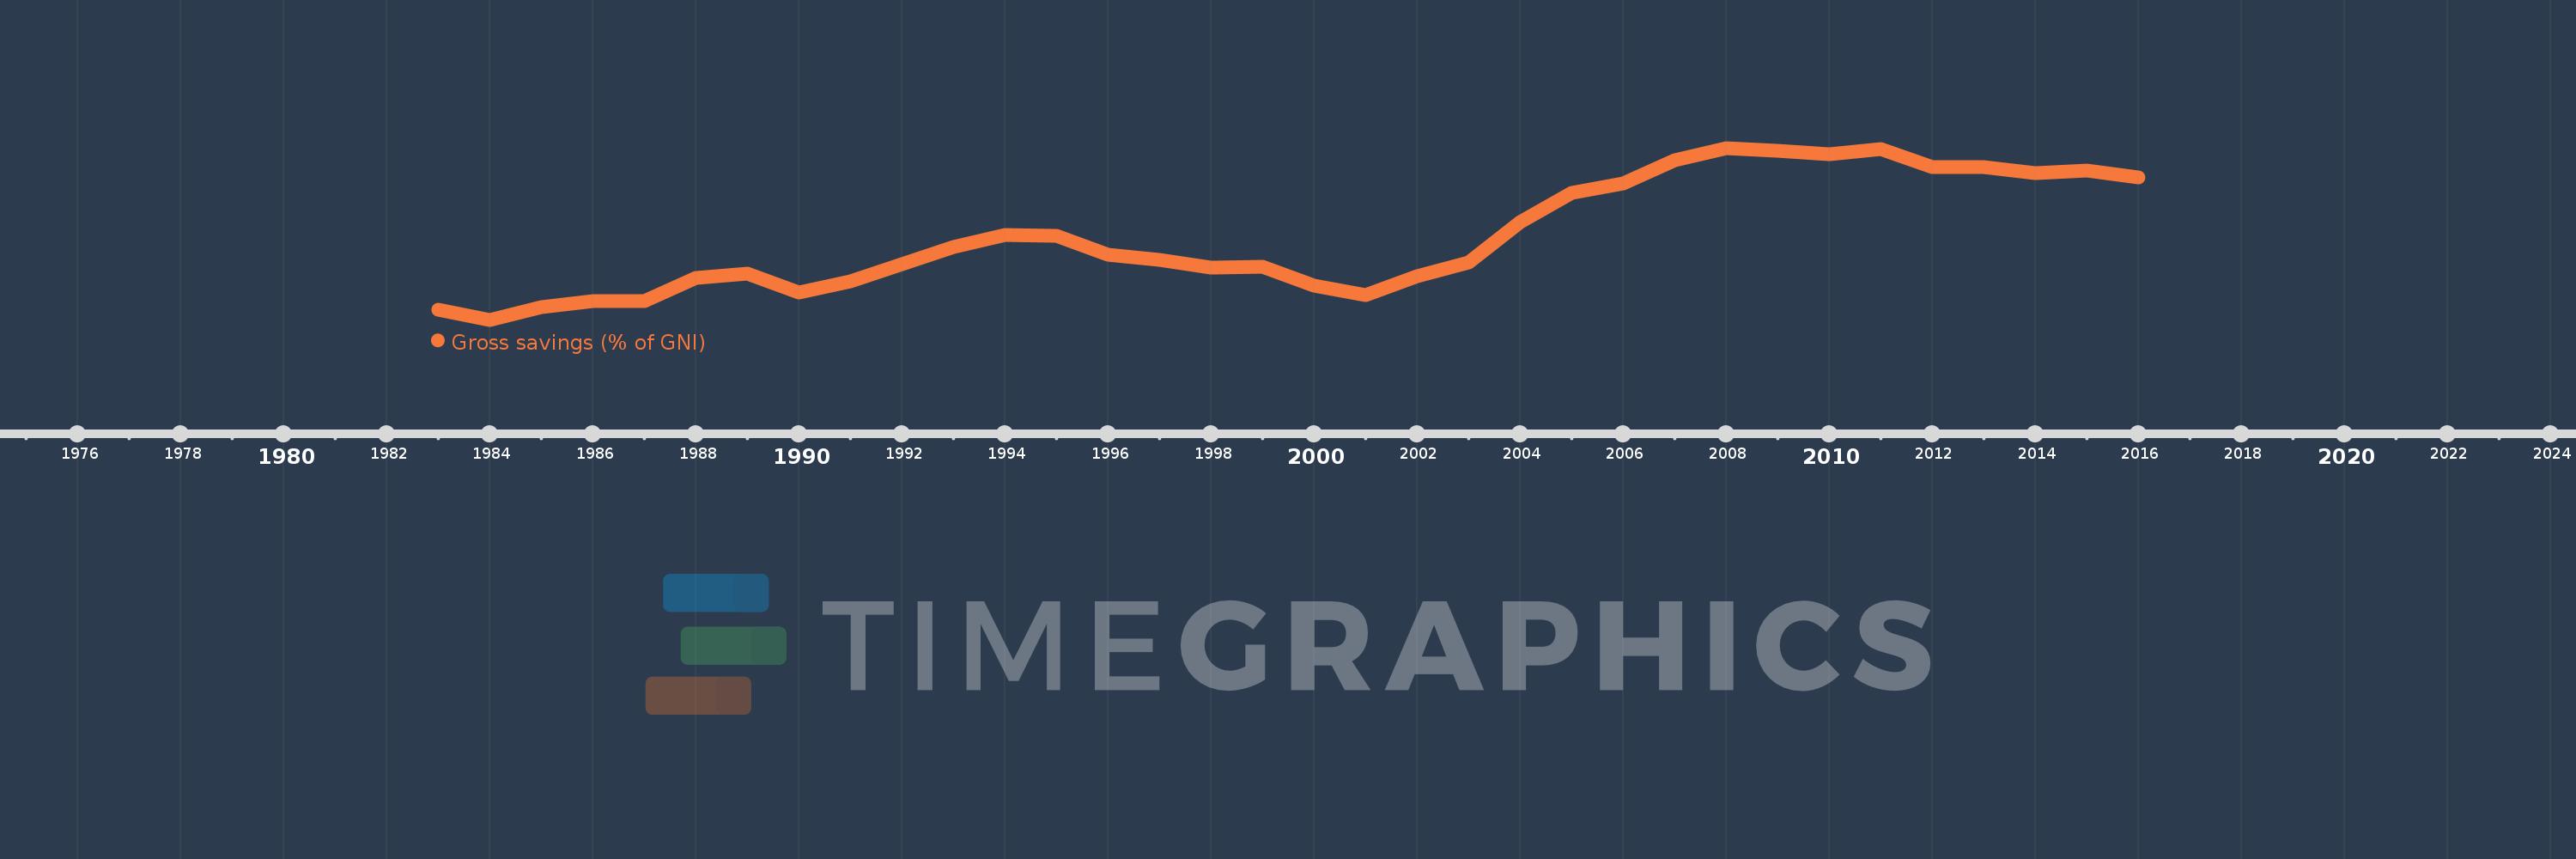
Gross savings (% of GNI)
2016,2015,2014,2013,2012,2011,2010,2009,2008,2007,2006,2005,2004,2003,2002,2001,2000,1999,1998,1997,1996,1995,1994,1993,1992,1991,1990,1989,1988,1987,1986,1985,1984,1983
Estas estadísticas en otros países:
AfghanistanAlbaniaAlgeriaAngolaAntigua and BarbudaArab WorldArgentinaArmeniaAustraliaAustriaAzerbaijanBahamas, TheBahrainBangladeshBarbadosBelarusBelgiumBelizeBeninBermudaBhutanBoliviaBosnia and HerzegovinaBotswanaBrazilBrunei DarussalamBulgariaBurkina FasoBurundiCabo VerdeCambodiaCameroonCanadaCaribbean small statesCentral African RepublicCentral Europe and the BalticsChadChileChinaColombiaComorosCongo, Dem. Rep.Congo, Rep.Costa RicaCote d'IvoireCroatiaCyprusCzech RepublicDenmarkDjiboutiDominicaDominican RepublicEarly-demographic dividendEast Asia & PacificEast Asia & Pacific (excluding high income)East Asia & Pacific (IDA & IBRD countries)EcuadorEgypt, Arab Rep.El SalvadorEquatorial GuineaEritreaEstoniaEthiopiaEuro areaEurope & Central AsiaEurope & Central Asia (excluding high income)Europe & Central Asia (IDA & IBRD countries)European UnionFaroe IslandsFijiFinlandFragile and conflict affected situationsFranceGabonGambia, TheGeorgiaGermanyGhanaGreeceGrenadaGuatemalaGuineaGuinea-BissauGuyanaHaitiHeavily indebted poor countries (HIPC)High incomeHondurasHong Kong SAR, ChinaHungaryIBRD onlyIcelandIDA & IBRD totalIDA blendIDA onlyIDA totalIndiaIndonesiaIran, Islamic Rep.IraqIrelandIsraelItalyJamaicaJapanJordanKazakhstanKenyaKiribatiKorea, Rep.KosovoKuwaitKyrgyz RepublicLao PDRLate-demographic dividendLatin America & Caribbean Latin America & Caribbean (excluding high income)Latin America & the Caribbean (IDA & IBRD countries)LatviaLeast developed countries: UN classificationLebanonLesothoLiberiaLibyaLithuaniaLow & middle incomeLow incomeLower middle incomeLuxembourgMacao SAR, ChinaMacedonia, FYRMadagascarMalawiMalaysiaMaldivesMaliMaltaMauritaniaMauritiusMexicoMiddle East & North AfricaMiddle East & North Africa (excluding high income)Middle East & North Africa (IDA & IBRD countries)Middle incomeMoldovaMongoliaMontenegroMoroccoMozambiqueNamibiaNepalNetherlandsNew ZealandNicaraguaNigerNigeriaNorth AmericaNorwayOECD membersOmanOther small statesPacific island small statesPakistanPanamaPapua New GuineaParaguayPeruPhilippinesPolandPortugalPost-demographic dividendPre-demographic dividendQatarRomaniaRussian FederationRwandaSaudi ArabiaSenegalSerbiaSeychellesSierra LeoneSingaporeSlovak RepublicSloveniaSmall statesSolomon IslandsSouth AfricaSouth AsiaSouth Asia (IDA & IBRD)South SudanSpainSri LankaSt. Kitts and NevisSt. LuciaSt. Vincent and the GrenadinesSub-Saharan Africa Sub-Saharan Africa (excluding high income)Sub-Saharan Africa (IDA & IBRD countries)SudanSurinameSwazilandSwedenSwitzerlandSyrian Arab RepublicTajikistanTanzaniaThailandTimor-LesteTogoTongaTrinidad and TobagoTunisiaTurkeyUgandaUkraineUnited KingdomUnited StatesUpper middle incomeUruguayVanuatuVenezuela, RBVietnamWest Bank and GazaWorldYemen, Rep.ZambiaZimbabwe línea de tiempo (timeline):
En esta escala de tiempo se presenta un gráfico de 1983 y 2016 de China. Los datos de 1982 están ausentes. El número de observaciones reales por fecha: 34.
Fuente (nombre):
Indicadores del desarrollo mundial
Fuente (organización):
World Bank national accounts data, and OECD National Accounts data files.
Categorías:
Economy & Growth
Se ha actualizado:
23 abr 2017 año
Los indicadores de los cambios de valor en los últimos años
Mínimo:
34.417
1 ene 1984 año
Máximo:
51.848
1 ene 2008 año
A la fecha de observación
Valor
Cambio absoluto
El cambio con respecto al valor anterior
1 ene 1983 año
35.462
+35.462
0.0%
1 ene 1984 año
34.417
-1.044
-2.95%
1 ene 1985 año
35.684
+1.267
3.68%
1 ene 1986 año
36.349
+0.665
1.86%
1 ene 1987 año
36.305
-0.044
-0.12%
1 ene 1988 año
38.672
+2.367
6.52%
1 ene 1989 año
39.085
+0.413
1.07%
1 ene 1990 año
37.164
-1.921
-4.91%
1 ene 1991 año
38.342
+1.178
3.17%
1 ene 1992 año
40.021
+1.679
4.38%
1 ene 1993 año
41.777
+1.756
4.39%
1 ene 1994 año
42.999
+1.222
2.93%
1 ene 1995 año
42.955
-0.044
-0.1%
1 ene 1996 año
41.048
-1.907
-4.44%
1 ene 1997 año
40.519
-0.529
-1.29%
1 ene 1998 año
39.68
-0.838
-2.07%
1 ene 1999 año
39.8
+0.12
0.3%
1 ene 2000 año
37.914
-1.887
-4.74%
1 ene 2001 año
36.905
-1.008
-2.66%
1 ene 2002 año
38.804
+1.898
5.14%
1 ene 2003 año
40.241
+1.437
3.7%
1 ene 2004 año
44.291
+4.05
10.06%
1 ene 2005 año
47.26
+2.969
6.7%
1 ene 2006 año
48.205
+0.945
2.0%
1 ene 2007 año
50.592
+2.387
4.95%
1 ene 2008 año
51.848
+1.257
2.48%
1 ene 2009 año
51.596
-0.252
-0.49%
1 ene 2010 año
51.189
-0.408
-0.79%
1 ene 2011 año
51.718
+0.53
1.03%
1 ene 2012 año
49.933
-1.785
-3.45%
1 ene 2013 año
49.867
-0.066
-0.13%
1 ene 2014 año
49.331
-0.536
-1.07%
1 ene 2015 año
49.594
+0.262
0.53%
1 ene 2016 año
48.879
-0.714
-1.44%
Ranking de los países por los datos estadísticos actuales


Comentarios: