29
/es/
es
AIzaSyAYiBZKx7MnpbEhh9jyipgxe19OcubqV5w
April 1, 2024
116962
Cyprus
CYP
true
2
1
Gross savings (% of GNI)
2016,2015,2014,2013,2012,2011,2010,2009,2008,2007,2006,2005,2004,2003,2002,2001,2000,1999,1998,1997,1996,1995,1994,1993,1992,1991,1990,1989,1988,1987,1986,1985,1984,1983,1982,1981,1980,1979,1978,1977
Estas estadísticas en otros países:
AfghanistanAlbaniaAlgeriaAngolaAntigua and BarbudaArab WorldArgentinaArmeniaAustraliaAustriaAzerbaijanBahamas, TheBahrainBangladeshBarbadosBelarusBelgiumBelizeBeninBermudaBhutanBoliviaBosnia and HerzegovinaBotswanaBrazilBrunei DarussalamBulgariaBurkina FasoBurundiCabo VerdeCambodiaCameroonCanadaCaribbean small statesCentral African RepublicCentral Europe and the BalticsChadChileChinaColombiaComorosCongo, Dem. Rep.Congo, Rep.Costa RicaCote d'IvoireCroatiaCyprusCzech RepublicDenmarkDjiboutiDominicaDominican RepublicEarly-demographic dividendEast Asia & PacificEast Asia & Pacific (excluding high income)East Asia & Pacific (IDA & IBRD countries)EcuadorEgypt, Arab Rep.El SalvadorEquatorial GuineaEritreaEstoniaEthiopiaEuro areaEurope & Central AsiaEurope & Central Asia (excluding high income)Europe & Central Asia (IDA & IBRD countries)European UnionFaroe IslandsFijiFinlandFragile and conflict affected situationsFranceGabonGambia, TheGeorgiaGermanyGhanaGreeceGrenadaGuatemalaGuineaGuinea-BissauGuyanaHaitiHeavily indebted poor countries (HIPC)High incomeHondurasHong Kong SAR, ChinaHungaryIBRD onlyIcelandIDA & IBRD totalIDA blendIDA onlyIDA totalIndiaIndonesiaIran, Islamic Rep.IraqIrelandIsraelItalyJamaicaJapanJordanKazakhstanKenyaKiribatiKorea, Rep.KosovoKuwaitKyrgyz RepublicLao PDRLate-demographic dividendLatin America & Caribbean Latin America & Caribbean (excluding high income)Latin America & the Caribbean (IDA & IBRD countries)LatviaLeast developed countries: UN classificationLebanonLesothoLiberiaLibyaLithuaniaLow & middle incomeLow incomeLower middle incomeLuxembourgMacao SAR, ChinaMacedonia, FYRMadagascarMalawiMalaysiaMaldivesMaliMaltaMauritaniaMauritiusMexicoMiddle East & North AfricaMiddle East & North Africa (excluding high income)Middle East & North Africa (IDA & IBRD countries)Middle incomeMoldovaMongoliaMontenegroMoroccoMozambiqueNamibiaNepalNetherlandsNew ZealandNicaraguaNigerNigeriaNorth AmericaNorwayOECD membersOmanOther small statesPacific island small statesPakistanPanamaPapua New GuineaParaguayPeruPhilippinesPolandPortugalPost-demographic dividendPre-demographic dividendQatarRomaniaRussian FederationRwandaSaudi ArabiaSenegalSerbiaSeychellesSierra LeoneSingaporeSlovak RepublicSloveniaSmall statesSolomon IslandsSouth AfricaSouth AsiaSouth Asia (IDA & IBRD)South SudanSpainSri LankaSt. Kitts and NevisSt. LuciaSt. Vincent and the GrenadinesSub-Saharan Africa Sub-Saharan Africa (excluding high income)Sub-Saharan Africa (IDA & IBRD countries)SudanSurinameSwazilandSwedenSwitzerlandSyrian Arab RepublicTajikistanTanzaniaThailandTimor-LesteTogoTongaTrinidad and TobagoTunisiaTurkeyUgandaUkraineUnited KingdomUnited StatesUpper middle incomeUruguayVanuatuVenezuela, RBVietnamWest Bank and GazaWorldYemen, Rep.ZambiaZimbabwe línea de tiempo (timeline):
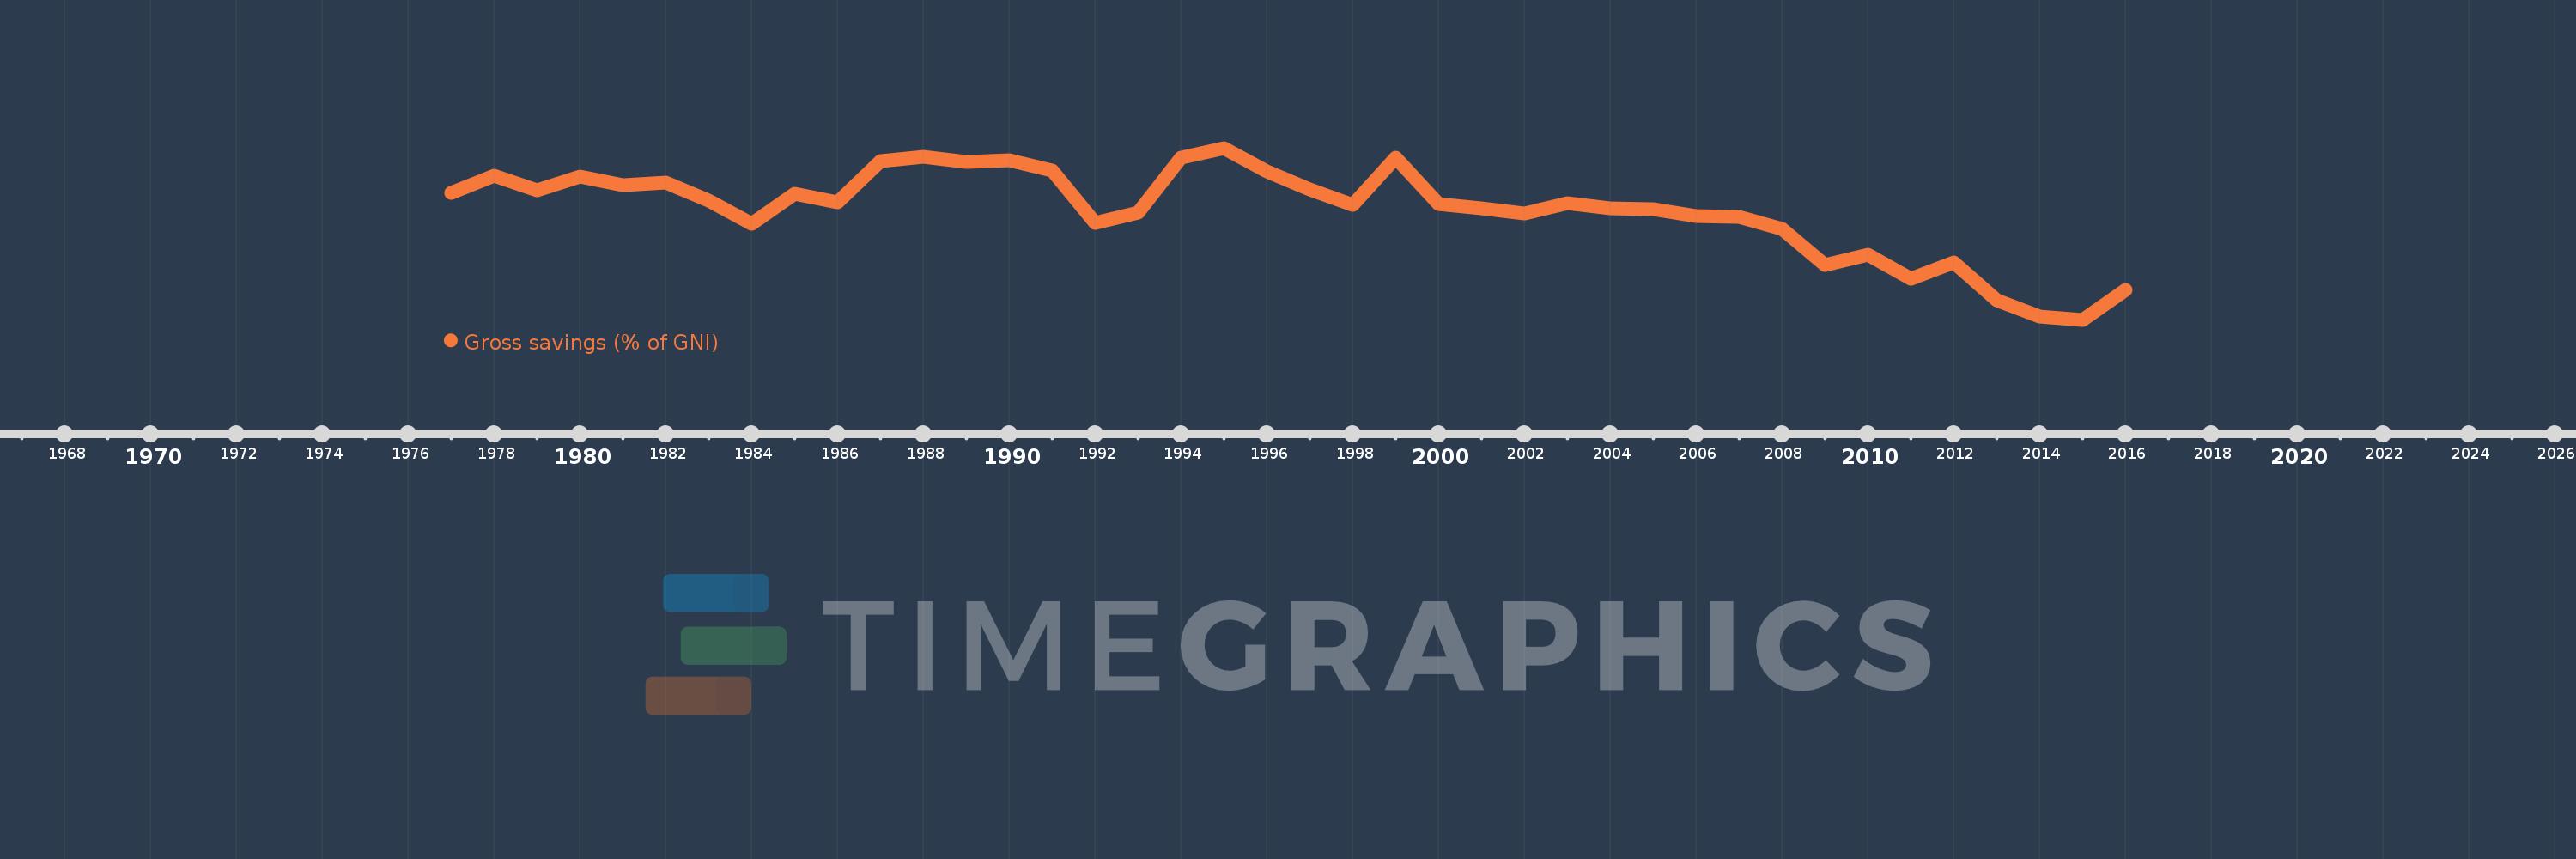
En esta escala de tiempo se presenta un gráfico de 1977 y 2016 de Cyprus. Los datos de 1976 están ausentes. El número de observaciones reales por fecha: 40.
Fuente (nombre):
Indicadores del desarrollo mundial
Fuente (organización):
World Bank national accounts data, and OECD National Accounts data files.
Categorías:
Economy & Growth
Se ha actualizado:
23 abr 2017 año
Los indicadores de los cambios de valor en los últimos años
Mínimo:
8.256
1 ene 2015 año
Máximo:
27.485
1 ene 1995 año
A la fecha de observación
Valor
Cambio absoluto
El cambio con respecto al valor anterior
1 ene 1977 año
22.467
+22.467
0.0%
1 ene 1978 año
24.359
+1.892
8.42%
1 ene 1979 año
22.711
-1.648
-6.76%
1 ene 1980 año
24.285
+1.574
6.93%
1 ene 1981 año
23.293
-0.992
-4.08%
1 ene 1982 año
23.606
+0.313
1.34%
1 ene 1983 año
21.624
-1.982
-8.4%
1 ene 1984 año
19.014
-2.61
-12.07%
1 ene 1985 año
22.38
+3.366
17.7%
1 ene 1986 año
21.405
-0.974
-4.35%
1 ene 1987 año
25.983
+4.577
21.38%
1 ene 1988 año
26.45
+0.467
1.8%
1 ene 1989 año
25.897
-0.553
-2.09%
1 ene 1990 año
26.157
+0.26
1.01%
1 ene 1991 año
24.925
-1.232
-4.71%
1 ene 1992 año
19.077
-5.848
-23.46%
1 ene 1993 año
20.218
+1.141
5.98%
1 ene 1994 año
26.431
+6.213
30.73%
1 ene 1995 año
27.485
+1.054
3.99%
1 ene 1996 año
24.835
-2.649
-9.64%
1 ene 1997 año
22.844
-1.991
-8.02%
1 ene 1998 año
21.082
-1.762
-7.71%
1 ene 1999 año
26.38
+5.298
25.13%
1 ene 2000 año
21.181
-5.199
-19.71%
1 ene 2001 año
20.756
-0.424
-2.0%
1 ene 2002 año
20.133
-0.623
-3.0%
1 ene 2003 año
21.302
+1.169
5.81%
1 ene 2004 año
20.761
-0.541
-2.54%
1 ene 2005 año
20.617
-0.145
-0.7%
1 ene 2006 año
19.864
-0.753
-3.65%
1 ene 2007 año
19.774
-0.09
-0.45%
1 ene 2008 año
18.387
-1.387
-7.01%
1 ene 2009 año
14.372
-4.015
-21.84%
1 ene 2010 año
15.58
+1.209
8.41%
1 ene 2011 año
12.879
-2.701
-17.34%
1 ene 2012 año
14.706
+1.827
14.18%
1 ene 2013 año
10.4
-4.306
-29.28%
1 ene 2014 año
8.63
-1.77
-17.02%
1 ene 2015 año
8.256
-0.375
-4.34%
1 ene 2016 año
11.593
+3.338
40.43%
Ranking de los países por los datos estadísticos actuales


Comentarios: