29
/es/
es
AIzaSyAYiBZKx7MnpbEhh9jyipgxe19OcubqV5w
April 1, 2024
84892
Benin
BEN
true
2
1
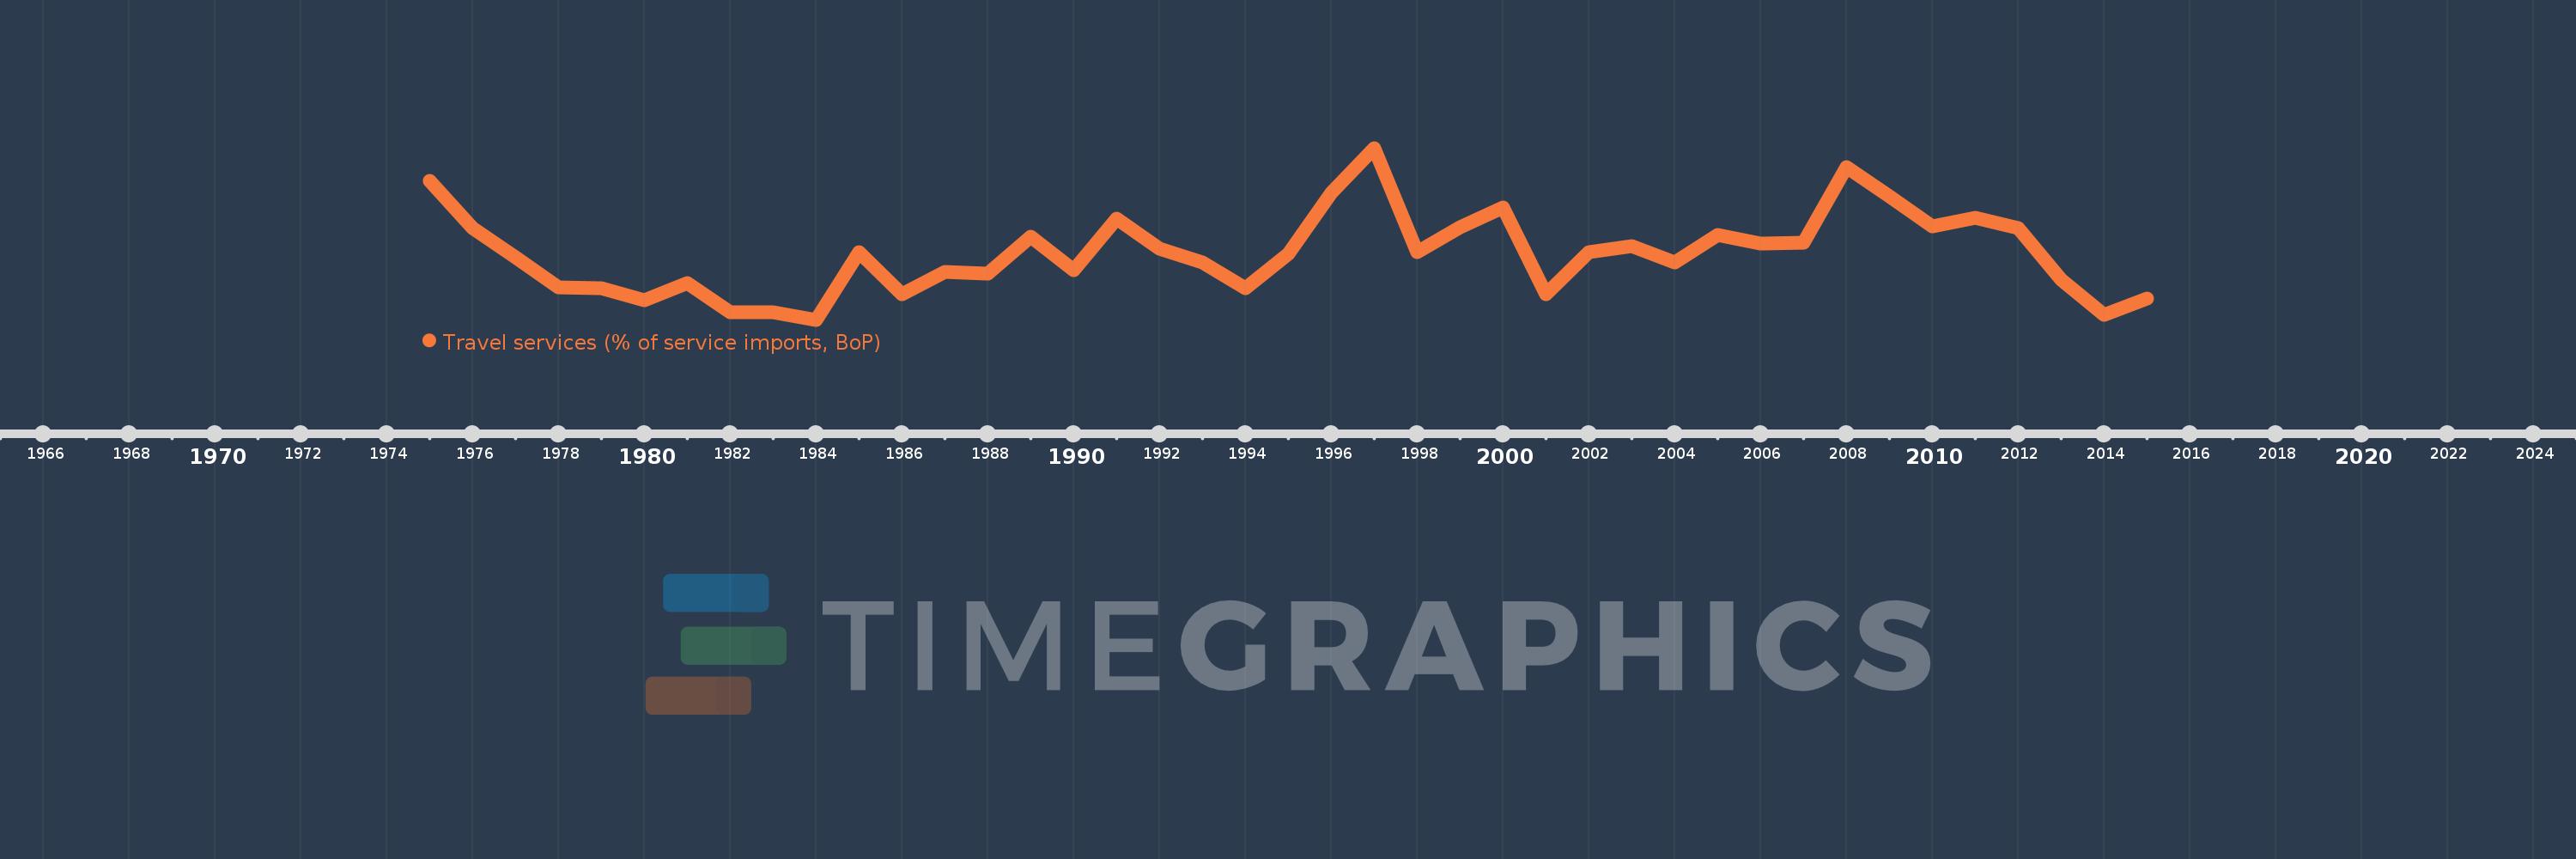
Travel services (% of service imports, BoP)
2015,2014,2013,2012,2011,2010,2009,2008,2007,2006,2005,2004,2003,2002,2001,2000,1999,1998,1997,1996,1995,1994,1993,1992,1991,1990,1989,1988,1987,1986,1985,1984,1983,1982,1981,1980,1979,1978,1977,1976,1975
Estas estadísticas en otros países:
AfghanistanAlbaniaAlgeriaAngolaAntigua and BarbudaArab WorldArgentinaArmeniaArubaAustraliaAustriaAzerbaijanBahamas, TheBahrainBangladeshBarbadosBelarusBelgiumBelizeBeninBermudaBhutanBoliviaBosnia and HerzegovinaBotswanaBrazilBrunei DarussalamBulgariaBurkina FasoBurundiCabo VerdeCambodiaCameroonCanadaCaribbean small statesCentral African RepublicCentral Europe and the BalticsChadChileChinaColombiaComorosCongo, Dem. Rep.Congo, Rep.Costa RicaCote d'IvoireCroatiaCuracaoCyprusCzech RepublicDenmarkDjiboutiDominicaDominican RepublicEarly-demographic dividendEast Asia & PacificEast Asia & Pacific (excluding high income)East Asia & Pacific (IDA & IBRD countries)EcuadorEgypt, Arab Rep.El SalvadorEritreaEstoniaEthiopiaEuro areaEurope & Central AsiaEurope & Central Asia (excluding high income)Europe & Central Asia (IDA & IBRD countries)European UnionFaroe IslandsFijiFinlandFragile and conflict affected situationsFranceFrench PolynesiaGabonGambia, TheGeorgiaGermanyGhanaGreeceGrenadaGuatemalaGuineaGuinea-BissauGuyanaHaitiHeavily indebted poor countries (HIPC)High incomeHondurasHong Kong SAR, ChinaHungaryIBRD onlyIcelandIDA & IBRD totalIDA onlyIDA totalIndiaIndonesiaIran, Islamic Rep.IraqIrelandIsraelItalyJamaicaJapanJordanKazakhstanKenyaKiribatiKorea, Rep.KosovoKuwaitKyrgyz RepublicLao PDRLate-demographic dividendLatin America & Caribbean Latin America & Caribbean (excluding high income)Latin America & the Caribbean (IDA & IBRD countries)LatviaLeast developed countries: UN classificationLebanonLesothoLiberiaLibyaLithuaniaLow & middle incomeLow incomeLower middle incomeLuxembourgMacao SAR, ChinaMacedonia, FYRMadagascarMalawiMalaysiaMaldivesMaliMaltaMarshall IslandsMauritaniaMauritiusMexicoMicronesia, Fed. Sts.Middle East & North AfricaMiddle East & North Africa (excluding high income)Middle East & North Africa (IDA & IBRD countries)Middle incomeMoldovaMongoliaMontenegroMoroccoMozambiqueMyanmarNamibiaNepalNetherlandsNew CaledoniaNew ZealandNicaraguaNigerNigeriaNorth AmericaNorwayOECD membersOmanOther small statesPacific island small statesPakistanPalauPanamaPapua New GuineaParaguayPeruPhilippinesPolandPortugalPost-demographic dividendPre-demographic dividendQatarRomaniaRussian FederationRwandaSamoaSao Tome and PrincipeSaudi ArabiaSenegalSerbiaSeychellesSierra LeoneSingaporeSint Maarten (Dutch part)Slovak RepublicSloveniaSmall statesSolomon IslandsSouth AfricaSouth AsiaSouth Asia (IDA & IBRD)South SudanSpainSri LankaSt. Kitts and NevisSt. LuciaSt. Vincent and the GrenadinesSub-Saharan Africa Sub-Saharan Africa (excluding high income)Sub-Saharan Africa (IDA & IBRD countries)SudanSurinameSwazilandSwedenSwitzerlandSyrian Arab RepublicTajikistanTanzaniaThailandTimor-LesteTogoTongaTrinidad and TobagoTunisiaTurkeyTuvaluUgandaUkraineUnited KingdomUnited StatesUpper middle incomeUruguayVanuatuVenezuela, RBWest Bank and GazaWorldYemen, Rep.ZambiaZimbabwe línea de tiempo (timeline):
En esta escala de tiempo se presenta un gráfico de 1975 y 2015 de Benin. Los datos de 1974 están ausentes. El número de observaciones reales por fecha: 41.
Fuente (nombre):
Indicadores del desarrollo mundial
Fuente (organización):
International Monetary Fund, Balance of Payments Statistics Yearbook and data files.
Categorías:
Economy & Growth, Trade
Se ha actualizado:
23 abr 2017 año
Los indicadores de los cambios de valor en los últimos años
Mínimo:
4.786
1 ene 1984 año
Máximo:
15.502
1 ene 1997 año
A la fecha de observación
Valor
Cambio absoluto
El cambio con respecto al valor anterior
1 ene 1975 año
13.475
+13.475
0.0%
1 ene 1976 año
10.504
-2.971
-22.05%
1 ene 1977 año
8.703
-1.801
-17.15%
1 ene 1978 año
6.785
-1.918
-22.04%
1 ene 1979 año
6.728
-0.057
-0.84%
1 ene 1980 año
6.013
-0.715
-10.63%
1 ene 1981 año
7.07
+1.057
17.58%
1 ene 1982 año
5.231
-1.838
-26.0%
1 ene 1983 año
5.247
+0.016
0.31%
1 ene 1984 año
4.786
-0.461
-8.79%
1 ene 1985 año
9.023
+4.237
88.52%
1 ene 1986 año
6.4
-2.623
-29.07%
1 ene 1987 año
7.748
+1.348
21.07%
1 ene 1988 año
7.637
-0.111
-1.43%
1 ene 1989 año
9.958
+2.321
30.39%
1 ene 1990 año
7.854
-2.104
-21.13%
1 ene 1991 año
11.112
+3.258
41.49%
1 ene 1992 año
9.241
-1.871
-16.84%
1 ene 1993 año
8.339
-0.902
-9.76%
1 ene 1994 año
6.727
-1.611
-19.32%
1 ene 1995 año
8.917
+2.19
32.56%
1 ene 1996 año
12.678
+3.76
42.17%
1 ene 1997 año
15.502
+2.824
22.27%
1 ene 1998 año
9.022
-6.479
-41.8%
1 ene 1999 año
10.55
+1.527
16.93%
1 ene 2000 año
11.776
+1.226
11.62%
1 ene 2001 año
6.365
-5.412
-45.95%
1 ene 2002 año
8.996
+2.631
41.34%
1 ene 2003 año
9.366
+0.37
4.11%
1 ene 2004 año
8.342
-1.024
-10.94%
1 ene 2005 año
10.056
+1.714
20.55%
1 ene 2006 año
9.559
-0.497
-4.94%
1 ene 2007 año
9.617
+0.058
0.6%
1 ene 2008 año
14.321
+4.704
48.91%
1 ene 2009 año
12.511
-1.81
-12.64%
1 ene 2010 año
10.591
-1.92
-15.35%
1 ene 2011 año
11.162
+0.571
5.39%
1 ene 2012 año
10.483
-0.678
-6.08%
1 ene 2013 año
7.309
-3.175
-30.28%
1 ene 2014 año
5.11
-2.199
-30.08%
1 ene 2015 año
6.124
+1.014
19.84%
Ranking de los países por los datos estadísticos actuales


Comentarios: