29
/es/
es
AIzaSyAYiBZKx7MnpbEhh9jyipgxe19OcubqV5w
April 1, 2024
31212
Europe & Central Asia
ECS
false
2
1
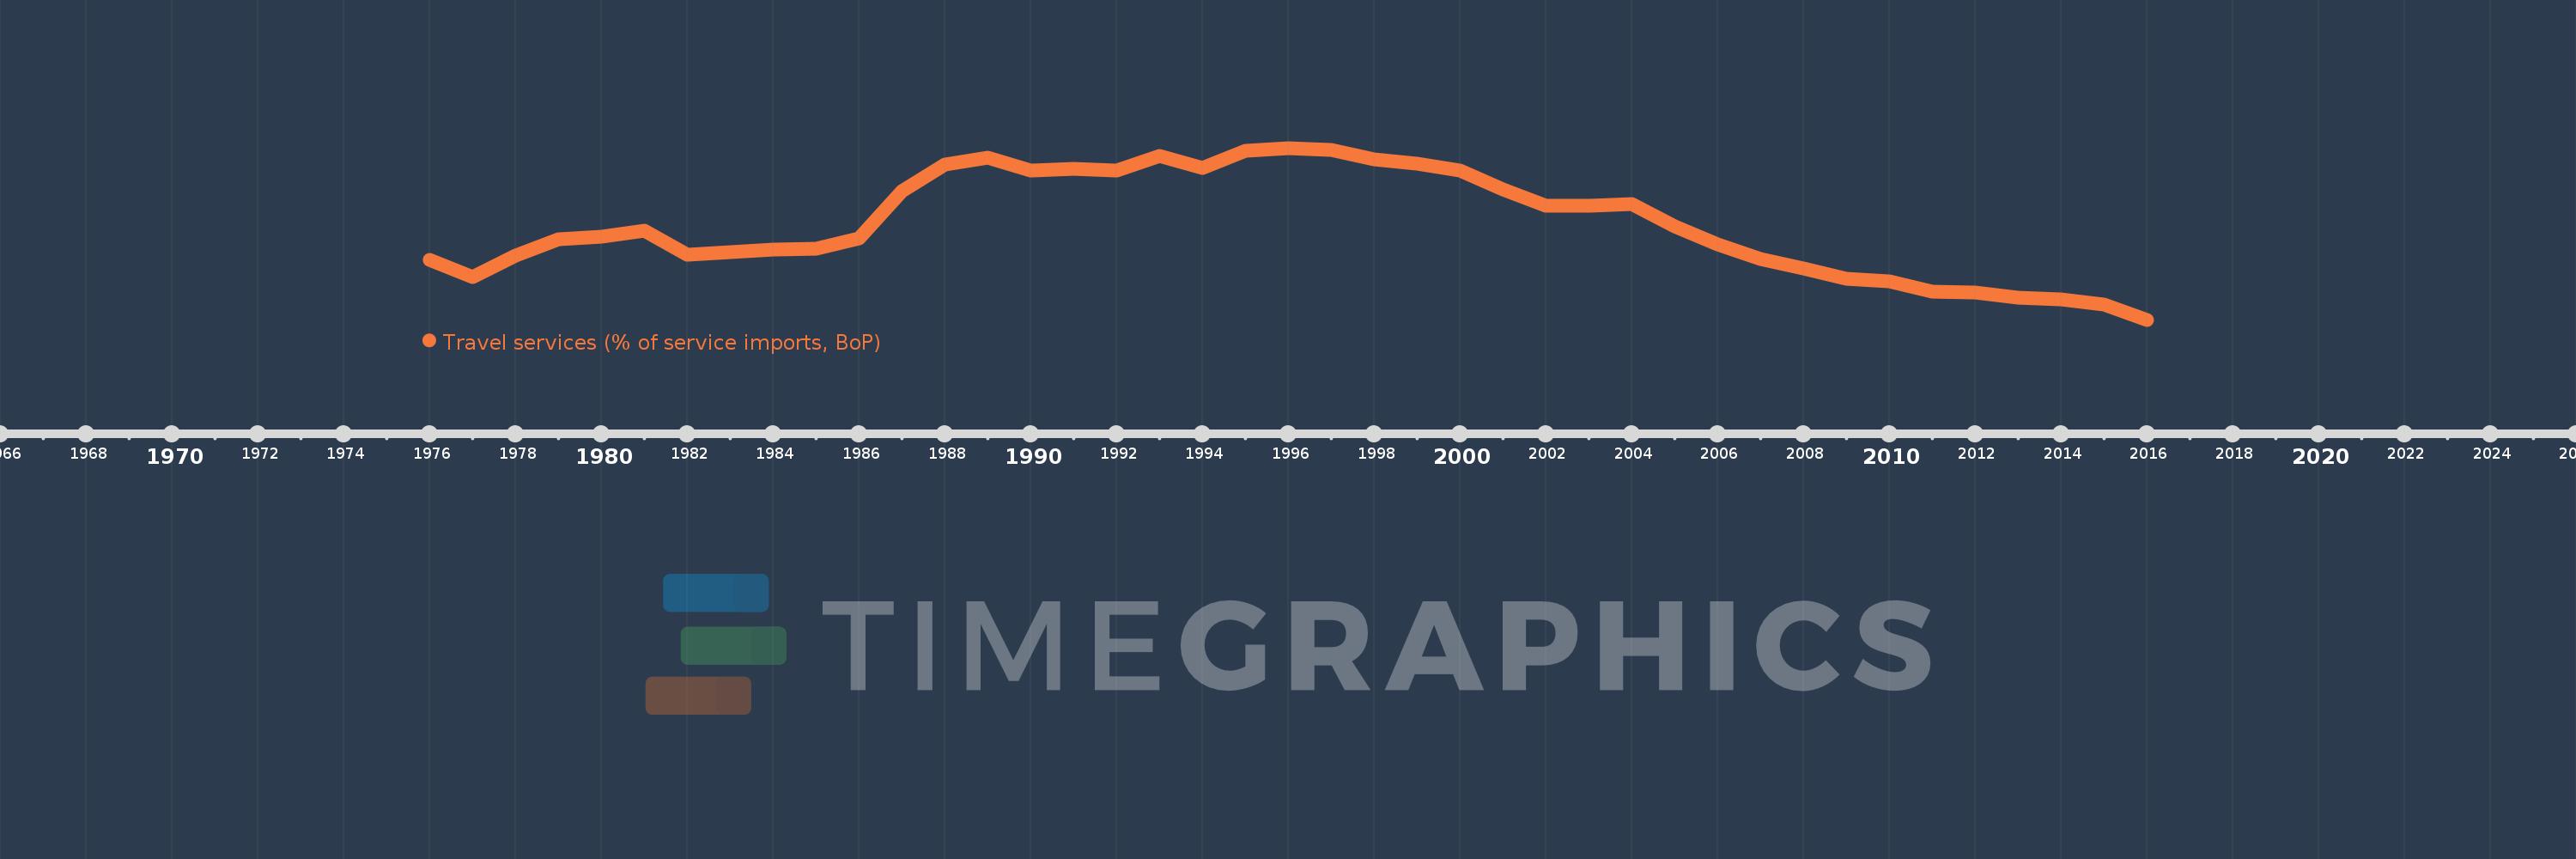
Travel services (% of service imports, BoP)
2016,2015,2014,2013,2012,2011,2010,2009,2008,2007,2006,2005,2004,2003,2002,2001,2000,1999,1998,1997,1996,1995,1994,1993,1992,1991,1990,1989,1988,1987,1986,1985,1984,1983,1982,1981,1980,1979,1978,1977,1976
Estas estadísticas en otros países:
AfghanistanAlbaniaAlgeriaAngolaAntigua and BarbudaArab WorldArgentinaArmeniaArubaAustraliaAustriaAzerbaijanBahamas, TheBahrainBangladeshBarbadosBelarusBelgiumBelizeBeninBermudaBhutanBoliviaBosnia and HerzegovinaBotswanaBrazilBrunei DarussalamBulgariaBurkina FasoBurundiCabo VerdeCambodiaCameroonCanadaCaribbean small statesCentral African RepublicCentral Europe and the BalticsChadChileChinaColombiaComorosCongo, Dem. Rep.Congo, Rep.Costa RicaCote d'IvoireCroatiaCuracaoCyprusCzech RepublicDenmarkDjiboutiDominicaDominican RepublicEarly-demographic dividendEast Asia & PacificEast Asia & Pacific (excluding high income)East Asia & Pacific (IDA & IBRD countries)EcuadorEgypt, Arab Rep.El SalvadorEritreaEstoniaEthiopiaEuro areaEurope & Central AsiaEurope & Central Asia (excluding high income)Europe & Central Asia (IDA & IBRD countries)European UnionFaroe IslandsFijiFinlandFragile and conflict affected situationsFranceFrench PolynesiaGabonGambia, TheGeorgiaGermanyGhanaGreeceGrenadaGuatemalaGuineaGuinea-BissauGuyanaHaitiHeavily indebted poor countries (HIPC)High incomeHondurasHong Kong SAR, ChinaHungaryIBRD onlyIcelandIDA & IBRD totalIDA onlyIDA totalIndiaIndonesiaIran, Islamic Rep.IraqIrelandIsraelItalyJamaicaJapanJordanKazakhstanKenyaKiribatiKorea, Rep.KosovoKuwaitKyrgyz RepublicLao PDRLate-demographic dividendLatin America & Caribbean Latin America & Caribbean (excluding high income)Latin America & the Caribbean (IDA & IBRD countries)LatviaLeast developed countries: UN classificationLebanonLesothoLiberiaLibyaLithuaniaLow & middle incomeLow incomeLower middle incomeLuxembourgMacao SAR, ChinaMacedonia, FYRMadagascarMalawiMalaysiaMaldivesMaliMaltaMarshall IslandsMauritaniaMauritiusMexicoMicronesia, Fed. Sts.Middle East & North AfricaMiddle East & North Africa (excluding high income)Middle East & North Africa (IDA & IBRD countries)Middle incomeMoldovaMongoliaMontenegroMoroccoMozambiqueMyanmarNamibiaNepalNetherlandsNew CaledoniaNew ZealandNicaraguaNigerNigeriaNorth AmericaNorwayOECD membersOmanOther small statesPacific island small statesPakistanPalauPanamaPapua New GuineaParaguayPeruPhilippinesPolandPortugalPost-demographic dividendPre-demographic dividendQatarRomaniaRussian FederationRwandaSamoaSao Tome and PrincipeSaudi ArabiaSenegalSerbiaSeychellesSierra LeoneSingaporeSint Maarten (Dutch part)Slovak RepublicSloveniaSmall statesSolomon IslandsSouth AfricaSouth AsiaSouth Asia (IDA & IBRD)South SudanSpainSri LankaSt. Kitts and NevisSt. LuciaSt. Vincent and the GrenadinesSub-Saharan Africa Sub-Saharan Africa (excluding high income)Sub-Saharan Africa (IDA & IBRD countries)SudanSurinameSwazilandSwedenSwitzerlandSyrian Arab RepublicTajikistanTanzaniaThailandTimor-LesteTogoTongaTrinidad and TobagoTunisiaTurkeyTuvaluUgandaUkraineUnited KingdomUnited StatesUpper middle incomeUruguayVanuatuVenezuela, RBWest Bank and GazaWorldYemen, Rep.ZambiaZimbabwe línea de tiempo (timeline):
En esta escala de tiempo se presenta un gráfico de 1976 y 2016 de Europe & Central Asia. Los datos de 1975 están ausentes. El número de observaciones reales por fecha: 41.
Fuente (nombre):
Indicadores del desarrollo mundial
Fuente (organización):
International Monetary Fund, Balance of Payments Statistics Yearbook and data files.
Categorías:
Economy & Growth, Trade
Se ha actualizado:
23 abr 2017 año
Los indicadores de los cambios de valor en los últimos años
Mínimo:
20.898
1 ene 2016 año
Máximo:
34.027
1 ene 1996 año
A la fecha de observación
Valor
Cambio absoluto
El cambio con respecto al valor anterior
1 ene 1976 año
25.497
+25.497
0.0%
1 ene 1977 año
24.176
-1.321
-5.18%
1 ene 1978 año
25.781
+1.605
6.64%
1 ene 1979 año
27.023
+1.242
4.82%
1 ene 1980 año
27.277
+0.254
0.94%
1 ene 1981 año
27.687
+0.41
1.5%
1 ene 1982 año
25.858
-1.83
-6.61%
1 ene 1983 año
26.061
+0.204
0.79%
1 ene 1984 año
26.273
+0.211
0.81%
1 ene 1985 año
26.312
+0.039
0.15%
1 ene 1986 año
27.101
+0.789
3.0%
1 ene 1987 año
30.752
+3.651
13.47%
1 ene 1988 año
32.757
+2.005
6.52%
1 ene 1989 año
33.271
+0.514
1.57%
1 ene 1990 año
32.298
-0.973
-2.92%
1 ene 1991 año
32.433
+0.136
0.42%
1 ene 1992 año
32.297
-0.136
-0.42%
1 ene 1993 año
33.414
+1.116
3.46%
1 ene 1994 año
32.502
-0.912
-2.73%
1 ene 1995 año
33.792
+1.291
3.97%
1 ene 1996 año
34.027
+0.235
0.7%
1 ene 1997 año
33.889
-0.138
-0.41%
1 ene 1998 año
33.155
-0.734
-2.16%
1 ene 1999 año
32.84
-0.315
-0.95%
1 ene 2000 año
32.279
-0.561
-1.71%
1 ene 2001 año
30.885
-1.395
-4.32%
1 ene 2002 año
29.627
-1.258
-4.07%
1 ene 2003 año
29.601
-0.026
-0.09%
1 ene 2004 año
29.744
+0.144
0.49%
1 ene 2005 año
28.013
-1.731
-5.82%
1 ene 2006 año
26.686
-1.327
-4.74%
1 ene 2007 año
25.531
-1.154
-4.32%
1 ene 2008 año
24.824
-0.707
-2.77%
1 ene 2009 año
24.051
-0.773
-3.11%
1 ene 2010 año
23.811
-0.24
-1.0%
1 ene 2011 año
23.052
-0.759
-3.19%
1 ene 2012 año
22.961
-0.091
-0.39%
1 ene 2013 año
22.615
-0.346
-1.51%
1 ene 2014 año
22.428
-0.187
-0.83%
1 ene 2015 año
22.066
-0.362
-1.61%
1 ene 2016 año
20.898
-1.168
-5.29%
Ranking de los países por los datos estadísticos actuales


Comentarios: