29
/es/
es
AIzaSyAYiBZKx7MnpbEhh9jyipgxe19OcubqV5w
April 1, 2024
57767
South Asia
SAS
false
2
1
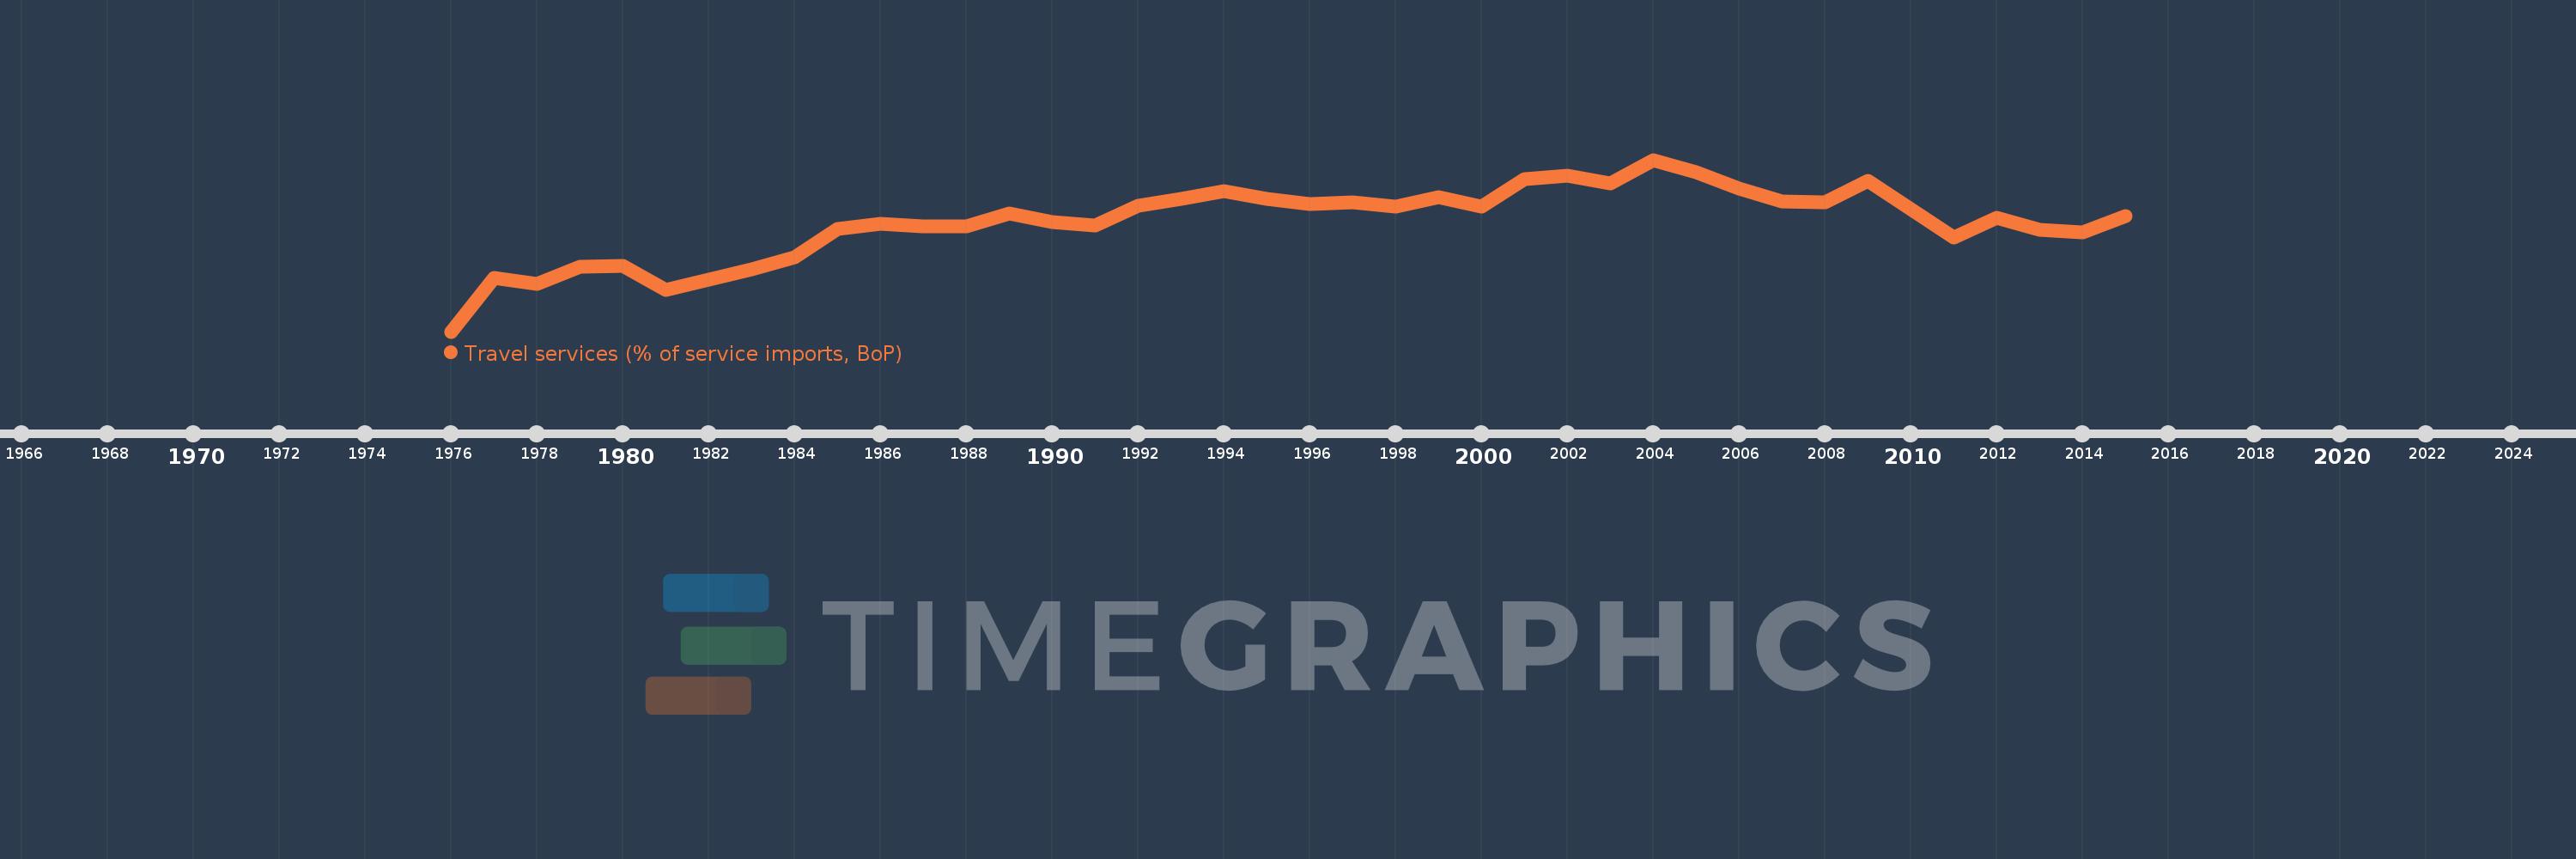
Travel services (% of service imports, BoP)
2015,2014,2013,2012,2011,2010,2009,2008,2007,2006,2005,2004,2003,2002,2001,2000,1999,1998,1997,1996,1995,1994,1993,1992,1991,1990,1989,1988,1987,1986,1985,1984,1983,1982,1981,1980,1979,1978,1977,1976
Estas estadísticas en otros países:
AfghanistanAlbaniaAlgeriaAngolaAntigua and BarbudaArab WorldArgentinaArmeniaArubaAustraliaAustriaAzerbaijanBahamas, TheBahrainBangladeshBarbadosBelarusBelgiumBelizeBeninBermudaBhutanBoliviaBosnia and HerzegovinaBotswanaBrazilBrunei DarussalamBulgariaBurkina FasoBurundiCabo VerdeCambodiaCameroonCanadaCaribbean small statesCentral African RepublicCentral Europe and the BalticsChadChileChinaColombiaComorosCongo, Dem. Rep.Congo, Rep.Costa RicaCote d'IvoireCroatiaCuracaoCyprusCzech RepublicDenmarkDjiboutiDominicaDominican RepublicEarly-demographic dividendEast Asia & PacificEast Asia & Pacific (excluding high income)East Asia & Pacific (IDA & IBRD countries)EcuadorEgypt, Arab Rep.El SalvadorEritreaEstoniaEthiopiaEuro areaEurope & Central AsiaEurope & Central Asia (excluding high income)Europe & Central Asia (IDA & IBRD countries)European UnionFaroe IslandsFijiFinlandFragile and conflict affected situationsFranceFrench PolynesiaGabonGambia, TheGeorgiaGermanyGhanaGreeceGrenadaGuatemalaGuineaGuinea-BissauGuyanaHaitiHeavily indebted poor countries (HIPC)High incomeHondurasHong Kong SAR, ChinaHungaryIBRD onlyIcelandIDA & IBRD totalIDA onlyIDA totalIndiaIndonesiaIran, Islamic Rep.IraqIrelandIsraelItalyJamaicaJapanJordanKazakhstanKenyaKiribatiKorea, Rep.KosovoKuwaitKyrgyz RepublicLao PDRLate-demographic dividendLatin America & Caribbean Latin America & Caribbean (excluding high income)Latin America & the Caribbean (IDA & IBRD countries)LatviaLeast developed countries: UN classificationLebanonLesothoLiberiaLibyaLithuaniaLow & middle incomeLow incomeLower middle incomeLuxembourgMacao SAR, ChinaMacedonia, FYRMadagascarMalawiMalaysiaMaldivesMaliMaltaMarshall IslandsMauritaniaMauritiusMexicoMicronesia, Fed. Sts.Middle East & North AfricaMiddle East & North Africa (excluding high income)Middle East & North Africa (IDA & IBRD countries)Middle incomeMoldovaMongoliaMontenegroMoroccoMozambiqueMyanmarNamibiaNepalNetherlandsNew CaledoniaNew ZealandNicaraguaNigerNigeriaNorth AmericaNorwayOECD membersOmanOther small statesPacific island small statesPakistanPalauPanamaPapua New GuineaParaguayPeruPhilippinesPolandPortugalPost-demographic dividendPre-demographic dividendQatarRomaniaRussian FederationRwandaSamoaSao Tome and PrincipeSaudi ArabiaSenegalSerbiaSeychellesSierra LeoneSingaporeSint Maarten (Dutch part)Slovak RepublicSloveniaSmall statesSolomon IslandsSouth AfricaSouth AsiaSouth Asia (IDA & IBRD)South SudanSpainSri LankaSt. Kitts and NevisSt. LuciaSt. Vincent and the GrenadinesSub-Saharan Africa Sub-Saharan Africa (excluding high income)Sub-Saharan Africa (IDA & IBRD countries)SudanSurinameSwazilandSwedenSwitzerlandSyrian Arab RepublicTajikistanTanzaniaThailandTimor-LesteTogoTongaTrinidad and TobagoTunisiaTurkeyTuvaluUgandaUkraineUnited KingdomUnited StatesUpper middle incomeUruguayVanuatuVenezuela, RBWest Bank and GazaWorldYemen, Rep.ZambiaZimbabwe línea de tiempo (timeline):
En esta escala de tiempo se presenta un gráfico de 1976 y 2015 de South Asia. Los datos de 1975 están ausentes. El número de observaciones reales por fecha: 40.
Fuente (nombre):
Indicadores del desarrollo mundial
Fuente (organización):
International Monetary Fund, Balance of Payments Statistics Yearbook and data files.
Categorías:
Economy & Growth, Trade
Se ha actualizado:
23 abr 2017 año
Los indicadores de los cambios de valor en los últimos años
Mínimo:
2.221
1 ene 1976 año
Máximo:
15.932
1 ene 2004 año
A la fecha de observación
Valor
Cambio absoluto
El cambio con respecto al valor anterior
1 ene 1976 año
2.221
+2.221
0.0%
1 ene 1977 año
6.53
+4.309
194.01%
1 ene 1978 año
6.031
-0.499
-7.65%
1 ene 1979 año
7.389
+1.358
22.52%
1 ene 1980 año
7.474
+0.084
1.14%
1 ene 1981 año
5.562
-1.912
-25.58%
1 ene 1982 año
6.344
+0.782
14.06%
1 ene 1983 año
7.214
+0.87
13.71%
1 ene 1984 año
8.14
+0.926
12.83%
1 ene 1985 año
10.401
+2.262
27.78%
1 ene 1986 año
10.831
+0.429
4.13%
1 ene 1987 año
10.609
-0.221
-2.05%
1 ene 1988 año
10.647
+0.038
0.35%
1 ene 1989 año
11.656
+1.01
9.48%
1 ene 1990 año
10.974
-0.683
-5.86%
1 ene 1991 año
10.67
-0.304
-2.77%
1 ene 1992 año
12.294
+1.624
15.22%
1 ene 1993 año
12.806
+0.513
4.17%
1 ene 1994 año
13.413
+0.606
4.74%
1 ene 1995 año
12.79
-0.623
-4.64%
1 ene 1996 año
12.435
-0.355
-2.78%
1 ene 1997 año
12.572
+0.137
1.1%
1 ene 1998 año
12.191
-0.38
-3.02%
1 ene 1999 año
12.975
+0.784
6.43%
1 ene 2000 año
12.194
-0.782
-6.02%
1 ene 2001 año
14.42
+2.226
18.26%
1 ene 2002 año
14.654
+0.234
1.62%
1 ene 2003 año
14.08
-0.574
-3.91%
1 ene 2004 año
15.932
+1.852
13.15%
1 ene 2005 año
14.931
-1.0
-6.28%
1 ene 2006 año
13.639
-1.292
-8.66%
1 ene 2007 año
12.633
-1.006
-7.37%
1 ene 2008 año
12.545
-0.088
-0.7%
1 ene 2009 año
14.258
+1.713
13.65%
1 ene 2010 año
11.963
-2.294
-16.09%
1 ene 2011 año
9.739
-2.224
-18.59%
1 ene 2012 año
11.286
+1.547
15.88%
1 ene 2013 año
10.324
-0.962
-8.53%
1 ene 2014 año
10.158
-0.165
-1.6%
1 ene 2015 año
11.461
+1.302
12.82%
Ranking de los países por los datos estadísticos actuales


Comentarios: