29
/es/
es
AIzaSyAYiBZKx7MnpbEhh9jyipgxe19OcubqV5w
April 1, 2024
79075
Bangladesh
BGD
true
2
1
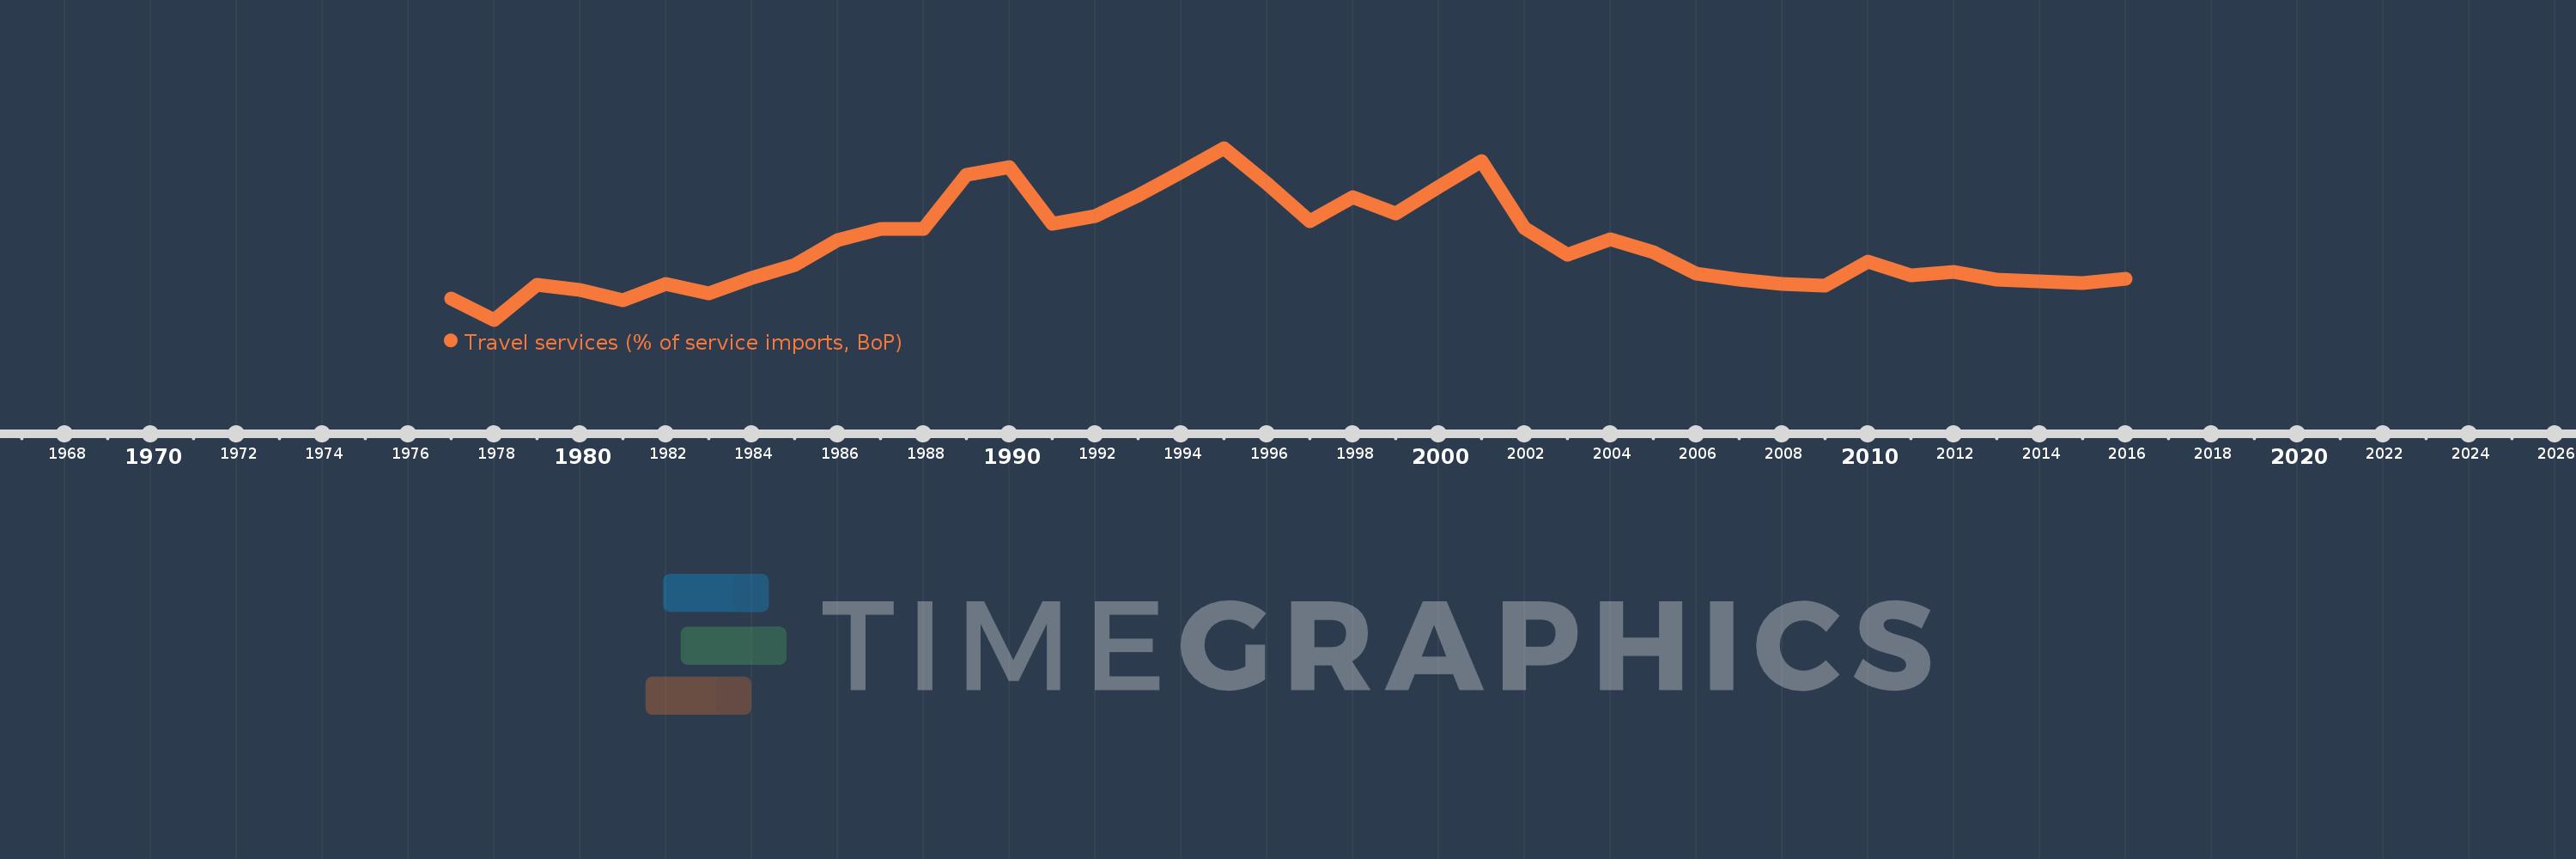
Travel services (% of service imports, BoP)
2016,2015,2014,2013,2012,2011,2010,2009,2008,2007,2006,2005,2004,2003,2002,2001,2000,1999,1998,1997,1996,1995,1994,1993,1992,1991,1990,1989,1988,1987,1986,1985,1984,1983,1982,1981,1980,1979,1978,1977
Estas estadísticas en otros países:
AfghanistanAlbaniaAlgeriaAngolaAntigua and BarbudaArab WorldArgentinaArmeniaArubaAustraliaAustriaAzerbaijanBahamas, TheBahrainBangladeshBarbadosBelarusBelgiumBelizeBeninBermudaBhutanBoliviaBosnia and HerzegovinaBotswanaBrazilBrunei DarussalamBulgariaBurkina FasoBurundiCabo VerdeCambodiaCameroonCanadaCaribbean small statesCentral African RepublicCentral Europe and the BalticsChadChileChinaColombiaComorosCongo, Dem. Rep.Congo, Rep.Costa RicaCote d'IvoireCroatiaCuracaoCyprusCzech RepublicDenmarkDjiboutiDominicaDominican RepublicEarly-demographic dividendEast Asia & PacificEast Asia & Pacific (excluding high income)East Asia & Pacific (IDA & IBRD countries)EcuadorEgypt, Arab Rep.El SalvadorEritreaEstoniaEthiopiaEuro areaEurope & Central AsiaEurope & Central Asia (excluding high income)Europe & Central Asia (IDA & IBRD countries)European UnionFaroe IslandsFijiFinlandFragile and conflict affected situationsFranceFrench PolynesiaGabonGambia, TheGeorgiaGermanyGhanaGreeceGrenadaGuatemalaGuineaGuinea-BissauGuyanaHaitiHeavily indebted poor countries (HIPC)High incomeHondurasHong Kong SAR, ChinaHungaryIBRD onlyIcelandIDA & IBRD totalIDA onlyIDA totalIndiaIndonesiaIran, Islamic Rep.IraqIrelandIsraelItalyJamaicaJapanJordanKazakhstanKenyaKiribatiKorea, Rep.KosovoKuwaitKyrgyz RepublicLao PDRLate-demographic dividendLatin America & Caribbean Latin America & Caribbean (excluding high income)Latin America & the Caribbean (IDA & IBRD countries)LatviaLeast developed countries: UN classificationLebanonLesothoLiberiaLibyaLithuaniaLow & middle incomeLow incomeLower middle incomeLuxembourgMacao SAR, ChinaMacedonia, FYRMadagascarMalawiMalaysiaMaldivesMaliMaltaMarshall IslandsMauritaniaMauritiusMexicoMicronesia, Fed. Sts.Middle East & North AfricaMiddle East & North Africa (excluding high income)Middle East & North Africa (IDA & IBRD countries)Middle incomeMoldovaMongoliaMontenegroMoroccoMozambiqueMyanmarNamibiaNepalNetherlandsNew CaledoniaNew ZealandNicaraguaNigerNigeriaNorth AmericaNorwayOECD membersOmanOther small statesPacific island small statesPakistanPalauPanamaPapua New GuineaParaguayPeruPhilippinesPolandPortugalPost-demographic dividendPre-demographic dividendQatarRomaniaRussian FederationRwandaSamoaSao Tome and PrincipeSaudi ArabiaSenegalSerbiaSeychellesSierra LeoneSingaporeSint Maarten (Dutch part)Slovak RepublicSloveniaSmall statesSolomon IslandsSouth AfricaSouth AsiaSouth Asia (IDA & IBRD)South SudanSpainSri LankaSt. Kitts and NevisSt. LuciaSt. Vincent and the GrenadinesSub-Saharan Africa Sub-Saharan Africa (excluding high income)Sub-Saharan Africa (IDA & IBRD countries)SudanSurinameSwazilandSwedenSwitzerlandSyrian Arab RepublicTajikistanTanzaniaThailandTimor-LesteTogoTongaTrinidad and TobagoTunisiaTurkeyTuvaluUgandaUkraineUnited KingdomUnited StatesUpper middle incomeUruguayVanuatuVenezuela, RBWest Bank and GazaWorldYemen, Rep.ZambiaZimbabwe línea de tiempo (timeline):
En esta escala de tiempo se presenta un gráfico de 1977 y 2016 de Bangladesh. Los datos de 1976 están ausentes. El número de observaciones reales por fecha: 40.
Fuente (nombre):
Indicadores del desarrollo mundial
Fuente (organización):
International Monetary Fund, Balance of Payments Statistics Yearbook and data files.
Categorías:
Economy & Growth, Trade
Se ha actualizado:
23 abr 2017 año
Los indicadores de los cambios de valor en los últimos años
Mínimo:
1.381
1 ene 1978 año
Máximo:
18.891
1 ene 1995 año
A la fecha de observación
Valor
Cambio absoluto
El cambio con respecto al valor anterior
1 ene 1977 año
3.514
+3.514
0.0%
1 ene 1978 año
1.381
-2.133
-60.71%
1 ene 1979 año
4.935
+3.555
257.47%
1 ene 1980 año
4.393
-0.542
-10.98%
1 ene 1981 año
3.345
-1.048
-23.85%
1 ene 1982 año
4.998
+1.653
49.41%
1 ene 1983 año
4.068
-0.93
-18.62%
1 ene 1984 año
5.634
+1.566
38.51%
1 ene 1985 año
6.941
+1.307
23.19%
1 ene 1986 año
9.477
+2.536
36.54%
1 ene 1987 año
10.668
+1.191
12.57%
1 ene 1988 año
10.616
-0.052
-0.49%
1 ene 1989 año
16.162
+5.546
52.24%
1 ene 1990 año
16.952
+0.791
4.89%
1 ene 1991 año
11.134
-5.818
-34.32%
1 ene 1992 año
11.93
+0.796
7.15%
1 ene 1993 año
14.056
+2.126
17.82%
1 ene 1994 año
16.439
+2.384
16.96%
1 ene 1995 año
18.891
+2.451
14.91%
1 ene 1996 año
15.249
-3.642
-19.28%
1 ene 1997 año
11.395
-3.854
-25.27%
1 ene 1998 año
13.843
+2.448
21.48%
1 ene 1999 año
12.18
-1.663
-12.02%
1 ene 2000 año
14.923
+2.744
22.53%
1 ene 2001 año
17.595
+2.671
17.9%
1 ene 2002 año
10.75
-6.845
-38.9%
1 ene 2003 año
8.008
-2.742
-25.5%
1 ene 2004 año
9.604
+1.596
19.93%
1 ene 2005 año
8.239
-1.366
-14.22%
1 ene 2006 año
6.125
-2.113
-25.65%
1 ene 2007 año
5.502
-0.624
-10.18%
1 ene 2008 año
5.052
-0.45
-8.18%
1 ene 2009 año
4.887
-0.165
-3.26%
1 ene 2010 año
7.337
+2.45
50.14%
1 ene 2011 año
5.937
-1.4
-19.08%
1 ene 2012 año
6.293
+0.356
5.99%
1 ene 2013 año
5.449
-0.844
-13.41%
1 ene 2014 año
5.328
-0.121
-2.22%
1 ene 2015 año
5.145
-0.183
-3.44%
1 ene 2016 año
5.52
+0.375
7.3%
Ranking de los países por los datos estadísticos actuales


Comentarios: