29
/es/
es
AIzaSyAYiBZKx7MnpbEhh9jyipgxe19OcubqV5w
April 1, 2024
84085
Benin
BEN
true
2
1
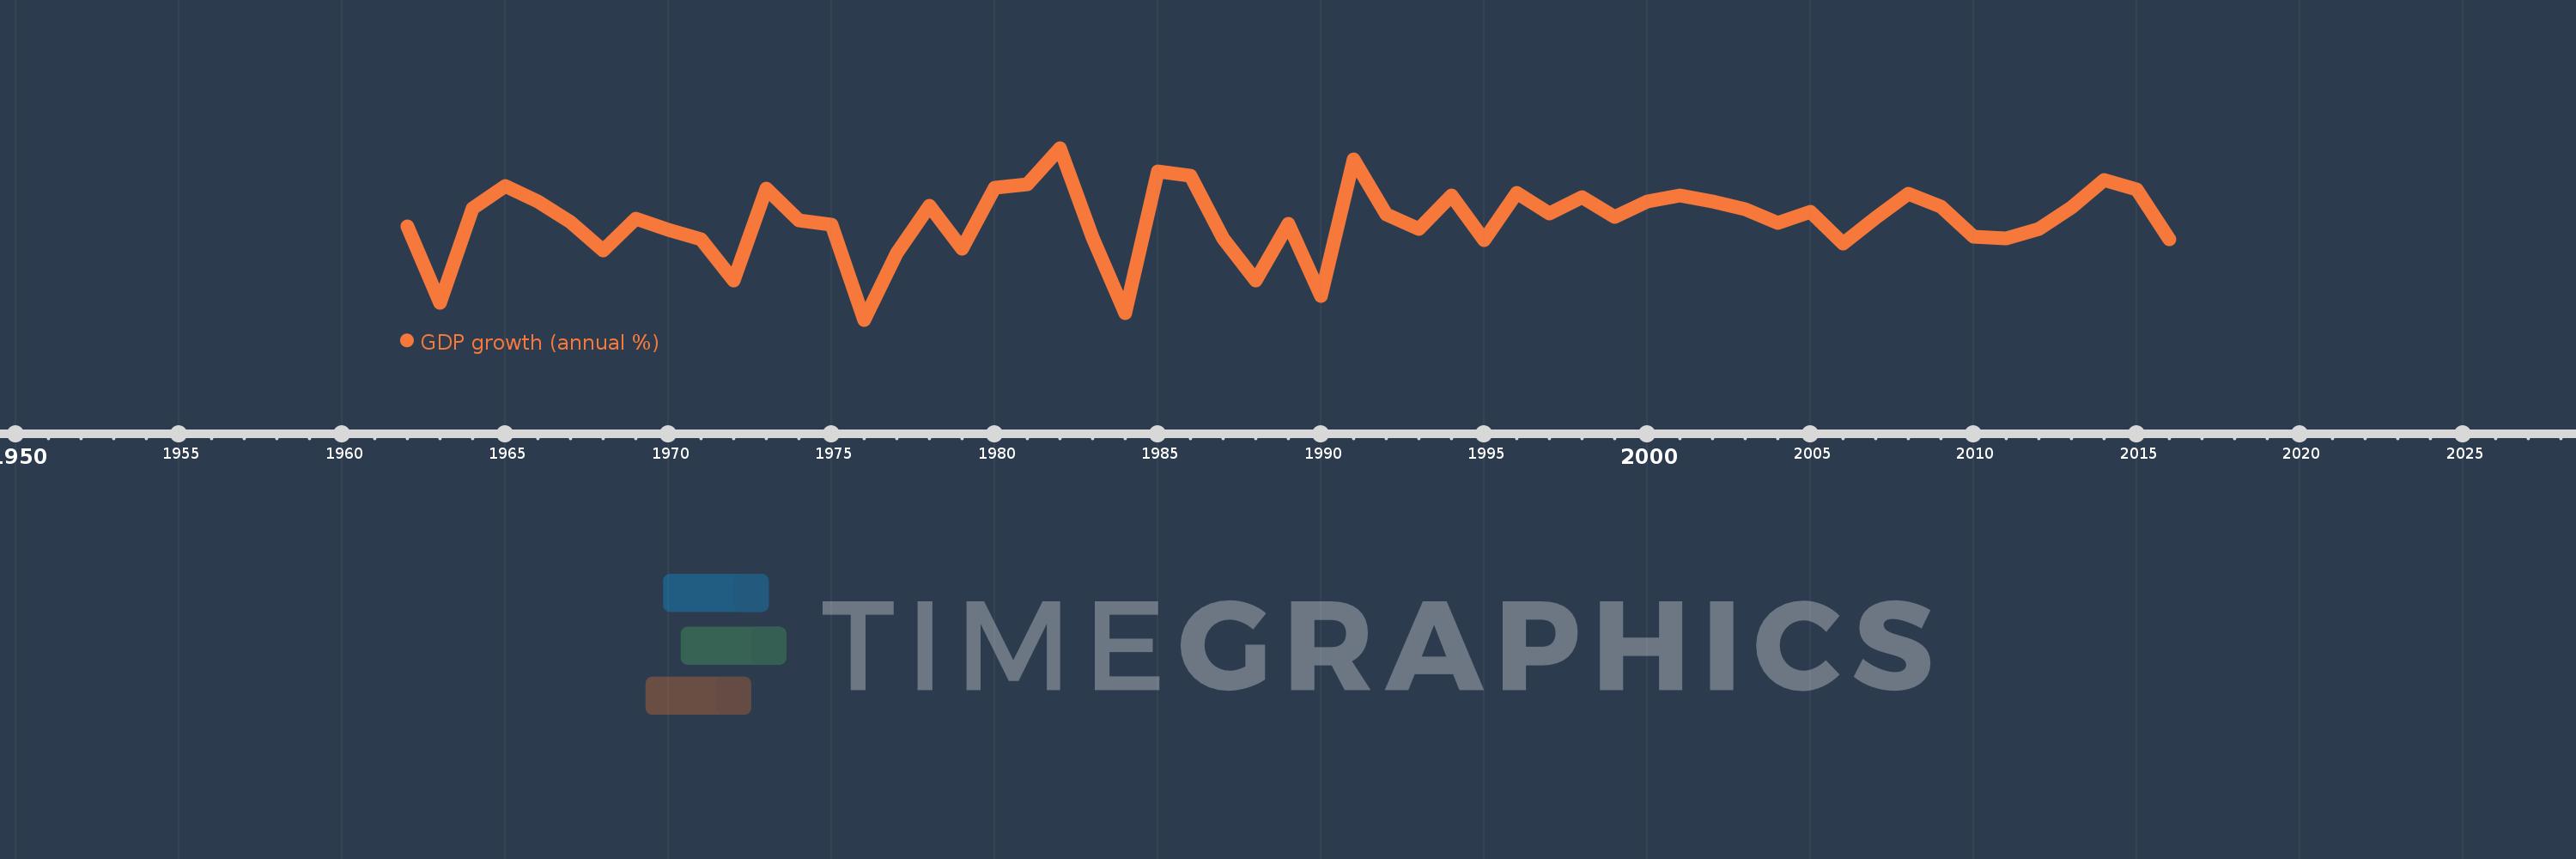
GDP growth (annual %)
2016,2015,2014,2013,2012,2011,2010,2009,2008,2007,2006,2005,2004,2003,2002,2001,2000,1999,1998,1997,1996,1995,1994,1993,1992,1991,1990,1989,1988,1987,1986,1985,1984,1983,1982,1981,1980,1979,1978,1977,1976,1975,1974,1973,1972,1971,1970,1969,1968,1967,1966,1965,1964,1963,1962
Estas estadísticas en otros países:
AfghanistanAlbaniaAlgeriaAndorraAngolaAntigua and BarbudaArab WorldArgentinaArmeniaArubaAustraliaAustriaAzerbaijanBahamas, TheBahrainBangladeshBarbadosBelarusBelgiumBelizeBeninBermudaBhutanBoliviaBosnia and HerzegovinaBotswanaBrazilBrunei DarussalamBulgariaBurkina FasoBurundiCabo VerdeCambodiaCameroonCanadaCaribbean small statesCayman IslandsCentral African RepublicCentral Europe and the BalticsChadChannel IslandsChileChinaColombiaComorosCongo, Dem. Rep.Congo, Rep.Costa RicaCote d'IvoireCroatiaCubaCyprusCzech RepublicDenmarkDjiboutiDominicaDominican RepublicEarly-demographic dividendEast Asia & PacificEast Asia & Pacific (excluding high income)East Asia & Pacific (IDA & IBRD countries)EcuadorEgypt, Arab Rep.El SalvadorEquatorial GuineaEritreaEstoniaEthiopiaEuro areaEurope & Central AsiaEurope & Central Asia (excluding high income)Europe & Central Asia (IDA & IBRD countries)European UnionFijiFinlandFragile and conflict affected situationsFranceFrench PolynesiaGabonGambia, TheGeorgiaGermanyGhanaGreeceGreenlandGrenadaGuatemalaGuineaGuinea-BissauGuyanaHaitiHeavily indebted poor countries (HIPC)High incomeHondurasHong Kong SAR, ChinaHungaryIBRD onlyIcelandIDA & IBRD totalIDA blendIDA onlyIDA totalIndiaIndonesiaIran, Islamic Rep.IraqIrelandIsle of ManIsraelItalyJamaicaJapanJordanKazakhstanKenyaKiribatiKorea, Rep.KosovoKuwaitKyrgyz RepublicLao PDRLate-demographic dividendLatin America & Caribbean Latin America & Caribbean (excluding high income)Latin America & the Caribbean (IDA & IBRD countries)LatviaLeast developed countries: UN classificationLebanonLesothoLiberiaLibyaLiechtensteinLithuaniaLow & middle incomeLow incomeLower middle incomeLuxembourgMacao SAR, ChinaMacedonia, FYRMadagascarMalawiMalaysiaMaldivesMaliMaltaMarshall IslandsMauritaniaMauritiusMexicoMicronesia, Fed. Sts.Middle East & North AfricaMiddle East & North Africa (excluding high income)Middle East & North Africa (IDA & IBRD countries)Middle incomeMoldovaMonacoMongoliaMontenegroMoroccoMozambiqueMyanmarNamibiaNauruNepalNetherlandsNew CaledoniaNew ZealandNicaraguaNigerNigeriaNorth AmericaNorwayOECD membersOmanOther small statesPacific island small statesPakistanPalauPanamaPapua New GuineaParaguayPeruPhilippinesPolandPortugalPost-demographic dividendPre-demographic dividendPuerto RicoQatarRomaniaRussian FederationRwandaSamoaSan MarinoSao Tome and PrincipeSaudi ArabiaSenegalSerbiaSeychellesSierra LeoneSingaporeSlovak RepublicSloveniaSmall statesSolomon IslandsSomaliaSouth AfricaSouth AsiaSouth Asia (IDA & IBRD)South SudanSpainSri LankaSt. Kitts and NevisSt. LuciaSt. Vincent and the GrenadinesSub-Saharan Africa Sub-Saharan Africa (excluding high income)Sub-Saharan Africa (IDA & IBRD countries)SudanSurinameSwazilandSwedenSwitzerlandSyrian Arab RepublicTajikistanTanzaniaThailandTimor-LesteTogoTongaTrinidad and TobagoTunisiaTurkeyTurkmenistanTuvaluUgandaUkraineUnited Arab EmiratesUnited KingdomUnited StatesUpper middle incomeUruguayUzbekistanVanuatuVenezuela, RBVietnamVirgin Islands (U.S.)West Bank and GazaWorldYemen, Rep.ZambiaZimbabwe línea de tiempo (timeline):
En esta escala de tiempo se presenta un gráfico de 1962 y 2016 de Benin. Los datos de 1961 están ausentes. El número de observaciones reales por fecha: 55.
Fuente (nombre):
Indicadores del desarrollo mundial
Fuente (organización):
World Bank national accounts data, and OECD National Accounts data files.
Categorías:
Economy & Growth
Se ha actualizado:
23 abr 2017 año
Los indicadores de los cambios de valor en los últimos años
Mínimo:
-4.895
1 ene 1976 año
Máximo:
9.954
1 ene 1982 año
A la fecha de observación
Valor
Cambio absoluto
El cambio con respecto al valor anterior
1 ene 1962 año
3.141
+3.141
0.0%
1 ene 1963 año
-3.426
-6.568
-209.08%
1 ene 1964 año
4.73
+8.156
-238.05%
1 ene 1965 año
6.651
+1.921
40.61%
1 ene 1966 año
5.294
-1.357
-20.4%
1 ene 1967 año
3.576
-1.718
-32.45%
1 ene 1968 año
1.078
-2.497
-69.84%
1 ene 1969 año
3.842
+2.764
256.3%
1 ene 1970 año
2.877
-0.965
-25.11%
1 ene 1971 año
2.098
-0.78
-27.1%
1 ene 1972 año
-1.497
-3.595
-171.35%
1 ene 1973 año
6.426
+7.923
-529.33%
1 ene 1974 año
3.706
-2.72
-42.33%
1 ene 1975 año
3.339
-0.367
-9.9%
1 ene 1976 año
-4.895
-8.235
-246.6%
1 ene 1977 año
0.884
+5.78
-118.07%
1 ene 1978 año
4.984
+4.099
463.54%
1 ene 1979 año
1.255
-3.729
-74.82%
1 ene 1980 año
6.536
+5.281
420.74%
1 ene 1981 año
6.782
+0.246
3.76%
1 ene 1982 año
9.954
+3.172
46.78%
1 ene 1983 año
2.235
-7.719
-77.55%
1 ene 1984 año
-4.348
-6.583
-294.53%
1 ene 1985 año
7.93
+12.278
-282.39%
1 ene 1986 año
7.53
-0.4
-5.04%
1 ene 1987 año
2.171
-5.359
-71.17%
1 ene 1988 año
-1.5
-3.671
-169.09%
1 ene 1989 año
3.405
+4.905
-327.02%
1 ene 1990 año
-2.854
-6.259
-183.82%
1 ene 1991 año
8.976
+11.83
-414.49%
1 ene 1992 año
4.226
-4.75
-52.92%
1 ene 1993 año
2.958
-1.268
-30.01%
1 ene 1994 año
5.836
+2.878
97.32%
1 ene 1995 año
2.02
-3.816
-65.38%
1 ene 1996 año
6.045
+4.025
199.21%
1 ene 1997 año
4.324
-1.721
-28.47%
1 ene 1998 año
5.735
+1.41
32.62%
1 ene 1999 año
3.961
-1.774
-30.93%
1 ene 2000 año
5.341
+1.38
34.85%
1 ene 2001 año
5.86
+0.519
9.71%
1 ene 2002 año
5.33
-0.53
-9.04%
1 ene 2003 año
4.644
-0.686
-12.87%
1 ene 2004 año
3.444
-1.2
-25.85%
1 ene 2005 año
4.43
+0.986
28.62%
1 ene 2006 año
1.712
-2.718
-61.36%
1 ene 2007 año
3.947
+2.235
130.61%
1 ene 2008 año
5.987
+2.04
51.67%
1 ene 2009 año
4.893
-1.093
-18.26%
1 ene 2010 año
2.319
-2.574
-52.6%
1 ene 2011 año
2.117
-0.202
-8.73%
1 ene 2012 año
2.963
+0.846
39.96%
1 ene 2013 año
4.81
+1.848
62.36%
1 ene 2014 año
7.193
+2.383
49.54%
1 ene 2015 año
6.358
-0.836
-11.62%
1 ene 2016 año
2.094
-4.263
-67.06%
Ranking de los países por los datos estadísticos actuales


Comentarios: