29
/es/
es
AIzaSyAYiBZKx7MnpbEhh9jyipgxe19OcubqV5w
April 1, 2024
167489
Kenya
KEN
true
2
1
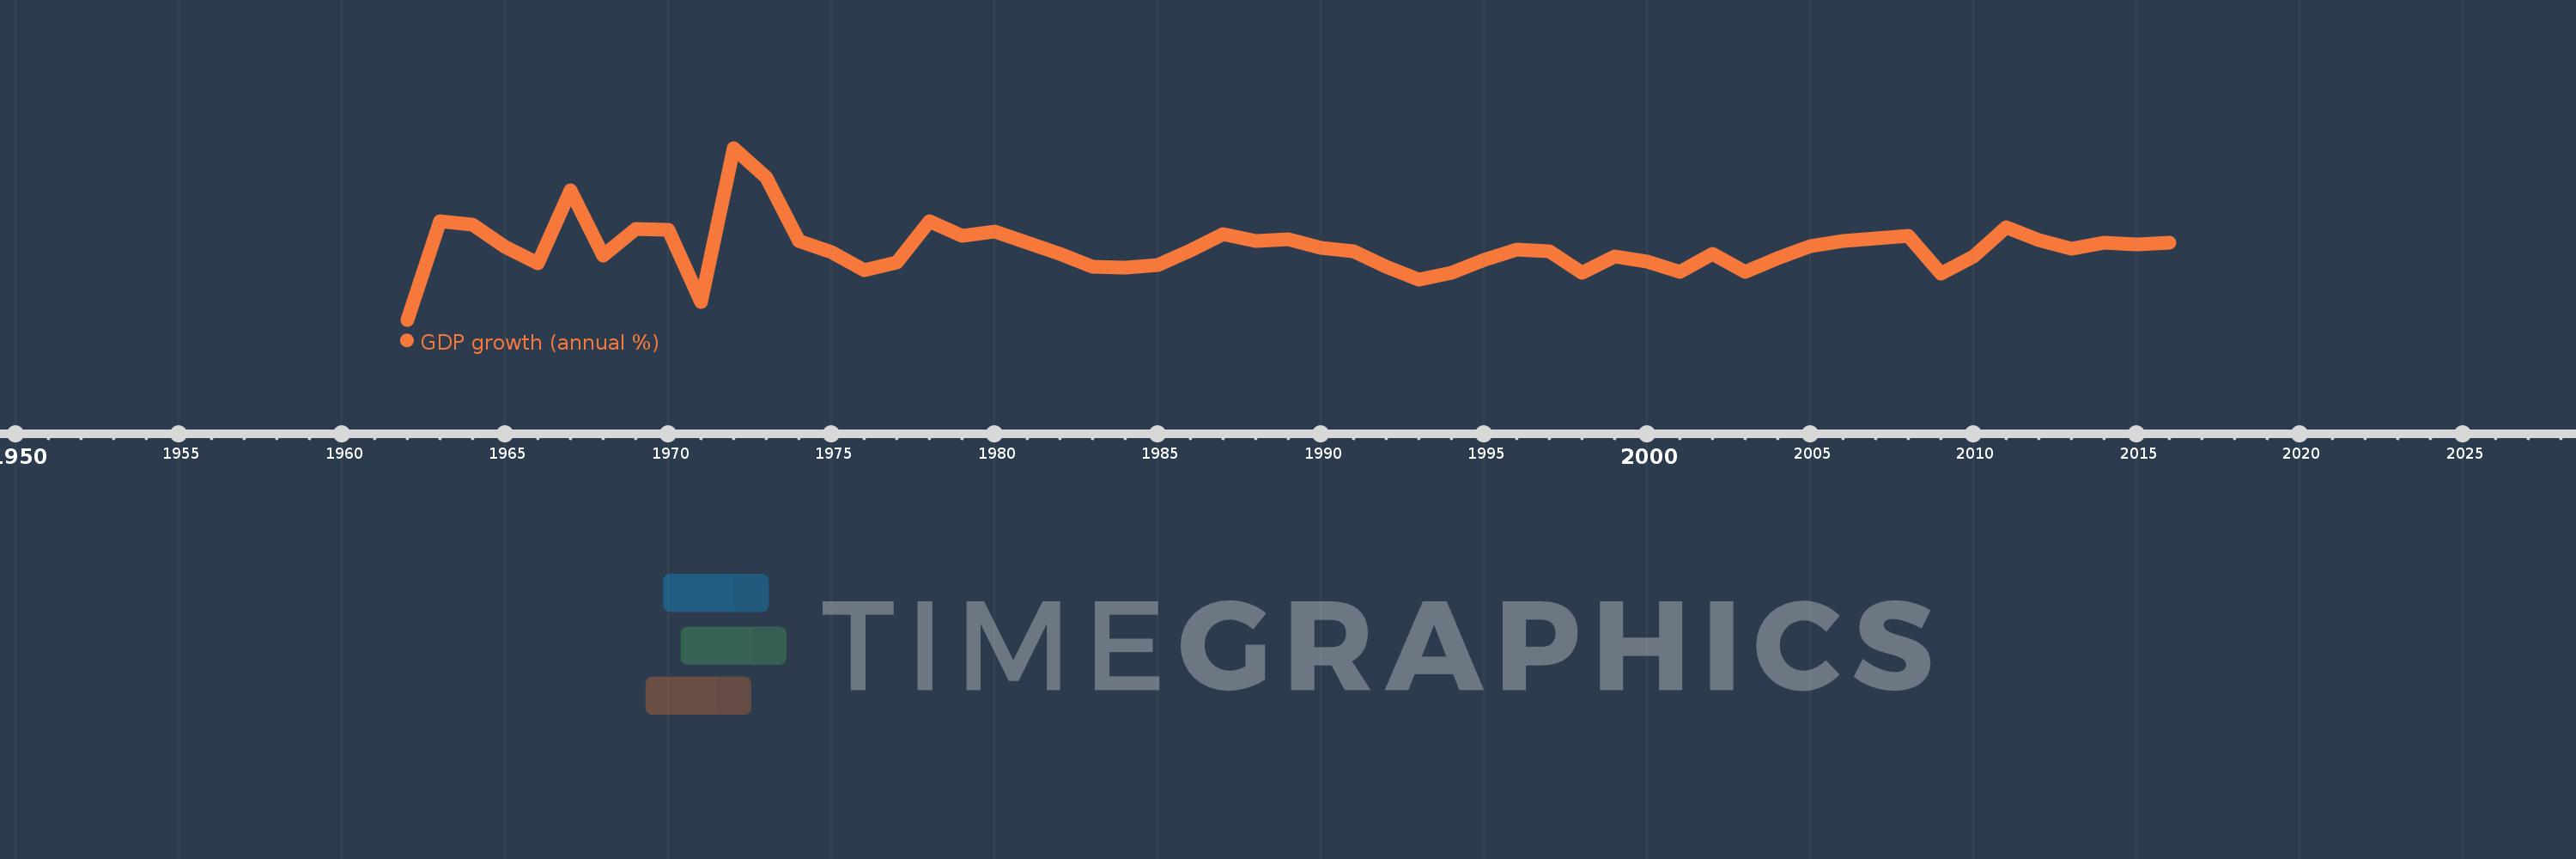
GDP growth (annual %)
2016,2015,2014,2013,2012,2011,2010,2009,2008,2007,2006,2005,2004,2003,2002,2001,2000,1999,1998,1997,1996,1995,1994,1993,1992,1991,1990,1989,1988,1987,1986,1985,1984,1983,1982,1981,1980,1979,1978,1977,1976,1975,1974,1973,1972,1971,1970,1969,1968,1967,1966,1965,1964,1963,1962
Estas estadísticas en otros países:
AfghanistanAlbaniaAlgeriaAndorraAngolaAntigua and BarbudaArab WorldArgentinaArmeniaArubaAustraliaAustriaAzerbaijanBahamas, TheBahrainBangladeshBarbadosBelarusBelgiumBelizeBeninBermudaBhutanBoliviaBosnia and HerzegovinaBotswanaBrazilBrunei DarussalamBulgariaBurkina FasoBurundiCabo VerdeCambodiaCameroonCanadaCaribbean small statesCayman IslandsCentral African RepublicCentral Europe and the BalticsChadChannel IslandsChileChinaColombiaComorosCongo, Dem. Rep.Congo, Rep.Costa RicaCote d'IvoireCroatiaCubaCyprusCzech RepublicDenmarkDjiboutiDominicaDominican RepublicEarly-demographic dividendEast Asia & PacificEast Asia & Pacific (excluding high income)East Asia & Pacific (IDA & IBRD countries)EcuadorEgypt, Arab Rep.El SalvadorEquatorial GuineaEritreaEstoniaEthiopiaEuro areaEurope & Central AsiaEurope & Central Asia (excluding high income)Europe & Central Asia (IDA & IBRD countries)European UnionFijiFinlandFragile and conflict affected situationsFranceFrench PolynesiaGabonGambia, TheGeorgiaGermanyGhanaGreeceGreenlandGrenadaGuatemalaGuineaGuinea-BissauGuyanaHaitiHeavily indebted poor countries (HIPC)High incomeHondurasHong Kong SAR, ChinaHungaryIBRD onlyIcelandIDA & IBRD totalIDA blendIDA onlyIDA totalIndiaIndonesiaIran, Islamic Rep.IraqIrelandIsle of ManIsraelItalyJamaicaJapanJordanKazakhstanKenyaKiribatiKorea, Rep.KosovoKuwaitKyrgyz RepublicLao PDRLate-demographic dividendLatin America & Caribbean Latin America & Caribbean (excluding high income)Latin America & the Caribbean (IDA & IBRD countries)LatviaLeast developed countries: UN classificationLebanonLesothoLiberiaLibyaLiechtensteinLithuaniaLow & middle incomeLow incomeLower middle incomeLuxembourgMacao SAR, ChinaMacedonia, FYRMadagascarMalawiMalaysiaMaldivesMaliMaltaMarshall IslandsMauritaniaMauritiusMexicoMicronesia, Fed. Sts.Middle East & North AfricaMiddle East & North Africa (excluding high income)Middle East & North Africa (IDA & IBRD countries)Middle incomeMoldovaMonacoMongoliaMontenegroMoroccoMozambiqueMyanmarNamibiaNauruNepalNetherlandsNew CaledoniaNew ZealandNicaraguaNigerNigeriaNorth AmericaNorwayOECD membersOmanOther small statesPacific island small statesPakistanPalauPanamaPapua New GuineaParaguayPeruPhilippinesPolandPortugalPost-demographic dividendPre-demographic dividendPuerto RicoQatarRomaniaRussian FederationRwandaSamoaSan MarinoSao Tome and PrincipeSaudi ArabiaSenegalSerbiaSeychellesSierra LeoneSingaporeSlovak RepublicSloveniaSmall statesSolomon IslandsSomaliaSouth AfricaSouth AsiaSouth Asia (IDA & IBRD)South SudanSpainSri LankaSt. Kitts and NevisSt. LuciaSt. Vincent and the GrenadinesSub-Saharan Africa Sub-Saharan Africa (excluding high income)Sub-Saharan Africa (IDA & IBRD countries)SudanSurinameSwazilandSwedenSwitzerlandSyrian Arab RepublicTajikistanTanzaniaThailandTimor-LesteTogoTongaTrinidad and TobagoTunisiaTurkeyTurkmenistanTuvaluUgandaUkraineUnited Arab EmiratesUnited KingdomUnited StatesUpper middle incomeUruguayUzbekistanVanuatuVenezuela, RBVietnamVirgin Islands (U.S.)West Bank and GazaWorldYemen, Rep.ZambiaZimbabwe línea de tiempo (timeline):
En esta escala de tiempo se presenta un gráfico de 1962 y 2016 de Kenya. Los datos de 1961 están ausentes. El número de observaciones reales por fecha: 55.
Fuente (nombre):
Indicadores del desarrollo mundial
Fuente (organización):
World Bank national accounts data, and OECD National Accounts data files.
Categorías:
Economy & Growth
Se ha actualizado:
23 abr 2017 año
Los indicadores de los cambios de valor en los últimos años
Mínimo:
-7.775
1 ene 1962 año
Máximo:
22.174
1 ene 1972 año
A la fecha de observación
Valor
Cambio absoluto
El cambio con respecto al valor anterior
1 ene 1962 año
-7.775
-7.775
0.0%
1 ene 1963 año
9.457
+17.232
-221.64%
1 ene 1964 año
8.778
-0.679
-7.18%
1 ene 1965 año
4.964
-3.814
-43.45%
1 ene 1966 año
2.009
-2.955
-59.53%
1 ene 1967 año
14.729
+12.719
633.09%
1 ene 1968 año
3.361
-11.367
-77.18%
1 ene 1969 año
7.983
+4.621
137.49%
1 ene 1970 año
7.959
-0.023
-0.29%
1 ene 1971 año
-4.655
-12.615
-158.49%
1 ene 1972 año
22.174
+26.829
-576.3%
1 ene 1973 año
17.082
-5.091
-22.96%
1 ene 1974 año
5.897
-11.186
-65.48%
1 ene 1975 año
4.066
-1.831
-31.05%
1 ene 1976 año
0.882
-3.183
-78.3%
1 ene 1977 año
2.154
+1.272
144.16%
1 ene 1978 año
9.454
+7.3
338.9%
1 ene 1979 año
6.912
-2.541
-26.88%
1 ene 1980 año
7.615
+0.703
10.17%
1 ene 1981 año
5.592
-2.023
-26.57%
1 ene 1982 año
3.774
-1.818
-32.52%
1 ene 1983 año
1.506
-2.267
-60.08%
1 ene 1984 año
1.309
-0.197
-13.11%
1 ene 1985 año
1.755
+0.446
34.08%
1 ene 1986 año
4.301
+2.545
145.02%
1 ene 1987 año
7.178
+2.877
66.9%
1 ene 1988 año
5.937
-1.24
-17.28%
1 ene 1989 año
6.203
+0.266
4.48%
1 ene 1990 año
4.69
-1.513
-24.39%
1 ene 1991 año
4.192
-0.498
-10.62%
1 ene 1992 año
1.438
-2.754
-65.69%
1 ene 1993 año
-0.799
-2.238
-155.58%
1 ene 1994 año
0.353
+1.153
-144.18%
1 ene 1995 año
2.633
+2.28
645.41%
1 ene 1996 año
4.406
+1.773
67.36%
1 ene 1997 año
4.147
-0.259
-5.89%
1 ene 1998 año
0.475
-3.672
-88.55%
1 ene 1999 año
3.29
+2.815
592.82%
1 ene 2000 año
2.305
-0.985
-29.93%
1 ene 2001 año
0.6
-1.706
-73.99%
1 ene 2002 año
3.78
+3.18
530.3%
1 ene 2003 año
0.547
-3.233
-85.53%
1 ene 2004 año
2.932
+2.386
436.24%
1 ene 2005 año
5.104
+2.172
74.06%
1 ene 2006 año
5.907
+0.802
15.72%
1 ene 2007 año
6.472
+0.566
9.58%
1 ene 2008 año
6.851
+0.378
5.84%
1 ene 2009 año
0.232
-6.618
-96.61%
1 ene 2010 año
3.307
+3.075
1.32 mil%
1 ene 2011 año
8.402
+5.095
154.08%
1 ene 2012 año
6.112
-2.291
-27.26%
1 ene 2013 año
4.555
-1.557
-25.47%
1 ene 2014 año
5.694
+1.139
25.0%
1 ene 2015 año
5.332
-0.362
-6.35%
1 ene 2016 año
5.649
+0.317
5.95%
Ranking de los países por los datos estadísticos actuales


Comentarios: