29
/es/
es
AIzaSyAYiBZKx7MnpbEhh9jyipgxe19OcubqV5w
April 1, 2024
223560
Philippines
PHL
true
2
1
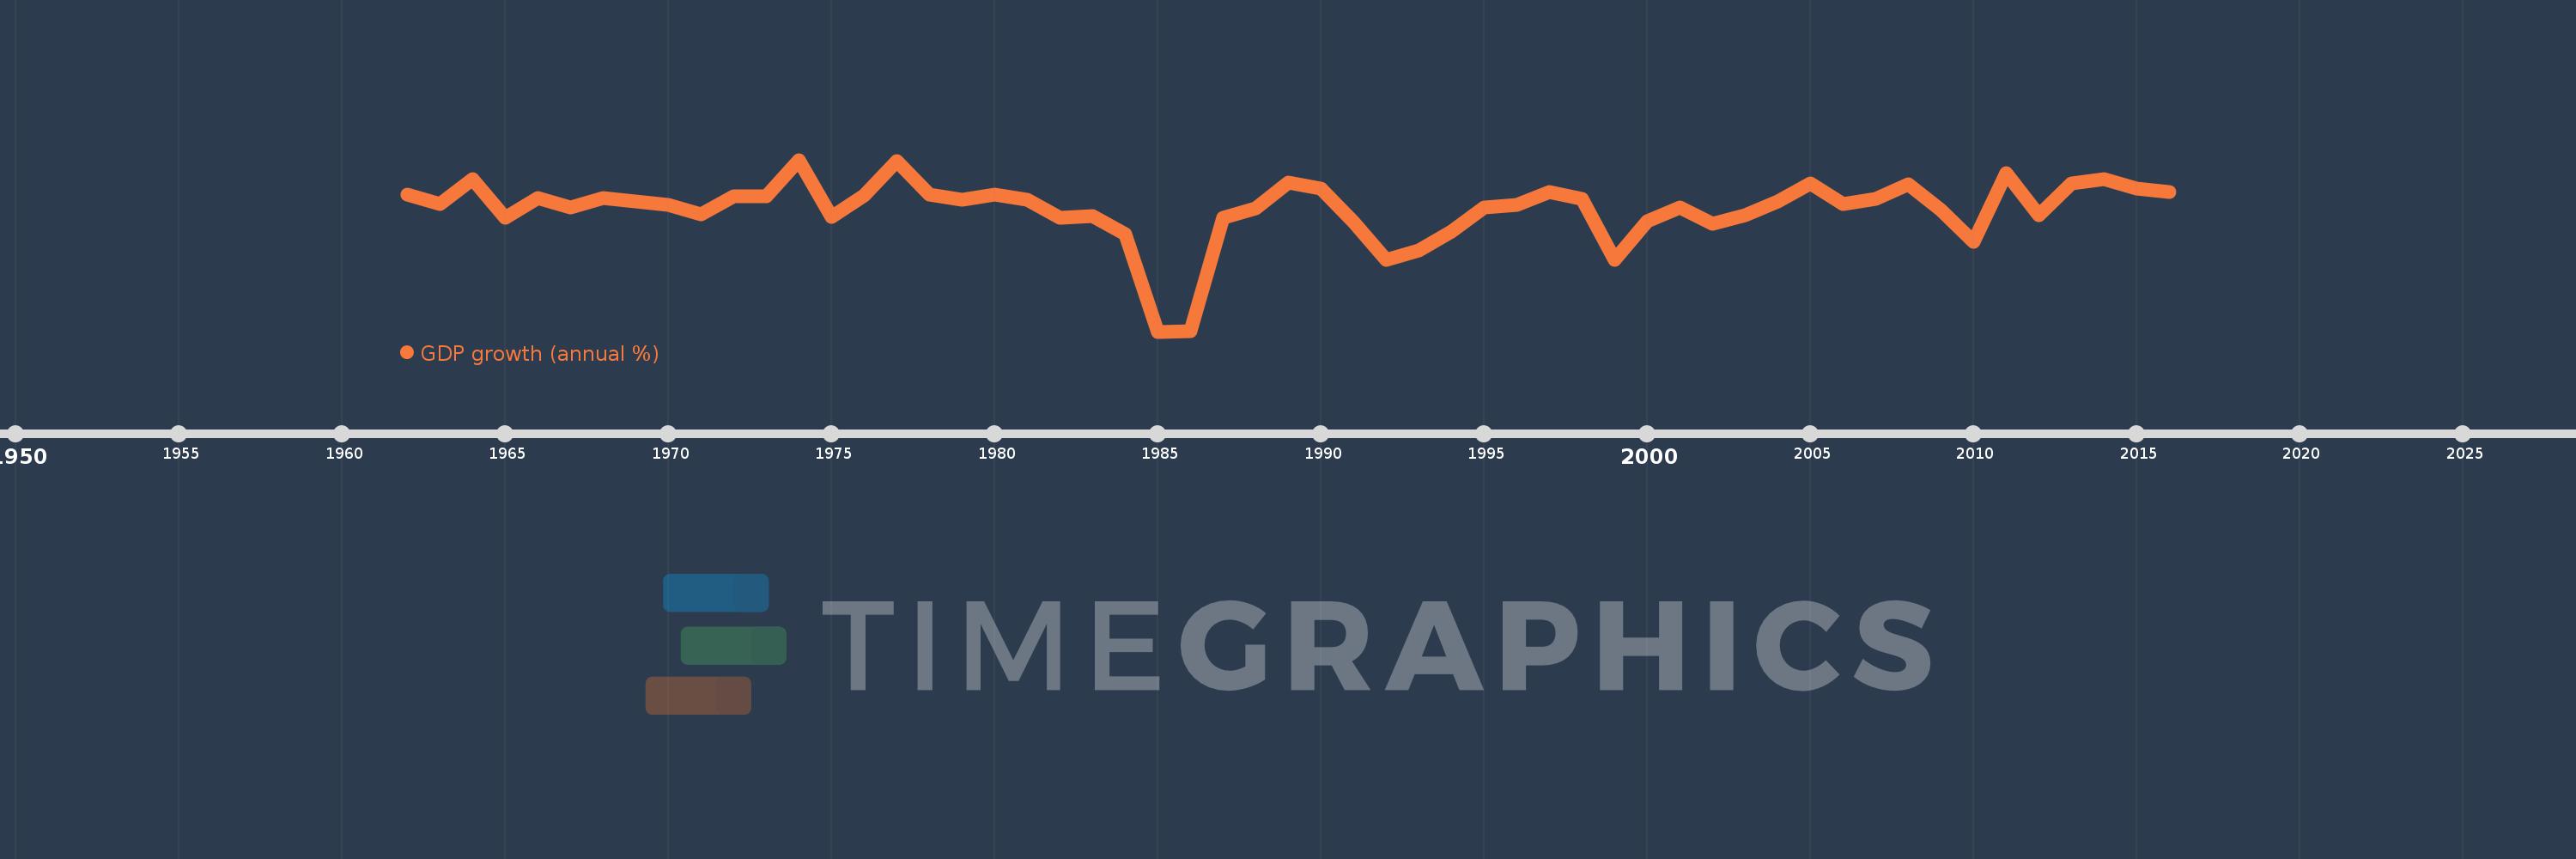
GDP growth (annual %)
2016,2015,2014,2013,2012,2011,2010,2009,2008,2007,2006,2005,2004,2003,2002,2001,2000,1999,1998,1997,1996,1995,1994,1993,1992,1991,1990,1989,1988,1987,1986,1985,1984,1983,1982,1981,1980,1979,1978,1977,1976,1975,1974,1973,1972,1971,1970,1969,1968,1967,1966,1965,1964,1963,1962
Estas estadísticas en otros países:
AfghanistanAlbaniaAlgeriaAndorraAngolaAntigua and BarbudaArab WorldArgentinaArmeniaArubaAustraliaAustriaAzerbaijanBahamas, TheBahrainBangladeshBarbadosBelarusBelgiumBelizeBeninBermudaBhutanBoliviaBosnia and HerzegovinaBotswanaBrazilBrunei DarussalamBulgariaBurkina FasoBurundiCabo VerdeCambodiaCameroonCanadaCaribbean small statesCayman IslandsCentral African RepublicCentral Europe and the BalticsChadChannel IslandsChileChinaColombiaComorosCongo, Dem. Rep.Congo, Rep.Costa RicaCote d'IvoireCroatiaCubaCyprusCzech RepublicDenmarkDjiboutiDominicaDominican RepublicEarly-demographic dividendEast Asia & PacificEast Asia & Pacific (excluding high income)East Asia & Pacific (IDA & IBRD countries)EcuadorEgypt, Arab Rep.El SalvadorEquatorial GuineaEritreaEstoniaEthiopiaEuro areaEurope & Central AsiaEurope & Central Asia (excluding high income)Europe & Central Asia (IDA & IBRD countries)European UnionFijiFinlandFragile and conflict affected situationsFranceFrench PolynesiaGabonGambia, TheGeorgiaGermanyGhanaGreeceGreenlandGrenadaGuatemalaGuineaGuinea-BissauGuyanaHaitiHeavily indebted poor countries (HIPC)High incomeHondurasHong Kong SAR, ChinaHungaryIBRD onlyIcelandIDA & IBRD totalIDA blendIDA onlyIDA totalIndiaIndonesiaIran, Islamic Rep.IraqIrelandIsle of ManIsraelItalyJamaicaJapanJordanKazakhstanKenyaKiribatiKorea, Rep.KosovoKuwaitKyrgyz RepublicLao PDRLate-demographic dividendLatin America & Caribbean Latin America & Caribbean (excluding high income)Latin America & the Caribbean (IDA & IBRD countries)LatviaLeast developed countries: UN classificationLebanonLesothoLiberiaLibyaLiechtensteinLithuaniaLow & middle incomeLow incomeLower middle incomeLuxembourgMacao SAR, ChinaMacedonia, FYRMadagascarMalawiMalaysiaMaldivesMaliMaltaMarshall IslandsMauritaniaMauritiusMexicoMicronesia, Fed. Sts.Middle East & North AfricaMiddle East & North Africa (excluding high income)Middle East & North Africa (IDA & IBRD countries)Middle incomeMoldovaMonacoMongoliaMontenegroMoroccoMozambiqueMyanmarNamibiaNauruNepalNetherlandsNew CaledoniaNew ZealandNicaraguaNigerNigeriaNorth AmericaNorwayOECD membersOmanOther small statesPacific island small statesPakistanPalauPanamaPapua New GuineaParaguayPeruPhilippinesPolandPortugalPost-demographic dividendPre-demographic dividendPuerto RicoQatarRomaniaRussian FederationRwandaSamoaSan MarinoSao Tome and PrincipeSaudi ArabiaSenegalSerbiaSeychellesSierra LeoneSingaporeSlovak RepublicSloveniaSmall statesSolomon IslandsSomaliaSouth AfricaSouth AsiaSouth Asia (IDA & IBRD)South SudanSpainSri LankaSt. Kitts and NevisSt. LuciaSt. Vincent and the GrenadinesSub-Saharan Africa Sub-Saharan Africa (excluding high income)Sub-Saharan Africa (IDA & IBRD countries)SudanSurinameSwazilandSwedenSwitzerlandSyrian Arab RepublicTajikistanTanzaniaThailandTimor-LesteTogoTongaTrinidad and TobagoTunisiaTurkeyTurkmenistanTuvaluUgandaUkraineUnited Arab EmiratesUnited KingdomUnited StatesUpper middle incomeUruguayUzbekistanVanuatuVenezuela, RBVietnamVirgin Islands (U.S.)West Bank and GazaWorldYemen, Rep.ZambiaZimbabwe línea de tiempo (timeline):
En esta escala de tiempo se presenta un gráfico de 1962 y 2016 de Philippines. Los datos de 1961 están ausentes. El número de observaciones reales por fecha: 55.
Fuente (nombre):
Indicadores del desarrollo mundial
Fuente (organización):
World Bank national accounts data, and OECD National Accounts data files.
Categorías:
Economy & Growth
Se ha actualizado:
23 abr 2017 año
Los indicadores de los cambios de valor en los últimos años
Mínimo:
-7.324
1 ene 1985 año
Máximo:
8.921
1 ene 1974 año
A la fecha de observación
Valor
Cambio absoluto
El cambio con respecto al valor anterior
1 ene 1962 año
5.617
+5.617
0.0%
1 ene 1963 año
4.773
-0.843
-15.02%
1 ene 1964 año
7.06
+2.287
47.92%
1 ene 1965 año
3.447
-3.614
-51.18%
1 ene 1966 año
5.266
+1.819
52.77%
1 ene 1967 año
4.426
-0.84
-15.95%
1 ene 1968 año
5.324
+0.898
20.29%
1 ene 1969 año
4.945
-0.379
-7.11%
1 ene 1970 año
4.656
-0.289
-5.84%
1 ene 1971 año
3.765
-0.892
-19.15%
1 ene 1972 año
5.429
+1.664
44.2%
1 ene 1973 año
5.447
+0.018
0.33%
1 ene 1974 año
8.921
+3.474
63.78%
1 ene 1975 año
3.558
-5.363
-60.11%
1 ene 1976 año
5.565
+2.007
56.4%
1 ene 1977 año
8.807
+3.242
58.26%
1 ene 1978 año
5.602
-3.205
-36.39%
1 ene 1979 año
5.172
-0.43
-7.67%
1 ene 1980 año
5.64
+0.468
9.04%
1 ene 1981 año
5.149
-0.491
-8.7%
1 ene 1982 año
3.423
-1.726
-33.51%
1 ene 1983 año
3.619
+0.196
5.73%
1 ene 1984 año
1.875
-1.745
-48.21%
1 ene 1985 año
-7.324
-9.198
-490.68%
1 ene 1986 año
-7.307
+0.017
-0.23%
1 ene 1987 año
3.417
+10.723
-146.76%
1 ene 1988 año
4.312
+0.895
26.19%
1 ene 1989 año
6.753
+2.441
56.61%
1 ene 1990 año
6.205
-0.547
-8.1%
1 ene 1991 año
3.037
-3.168
-51.06%
1 ene 1992 año
-0.578
-3.615
-119.04%
1 ene 1993 año
0.338
+0.916
-158.38%
1 ene 1994 año
2.116
+1.779
526.86%
1 ene 1995 año
4.388
+2.271
107.32%
1 ene 1996 año
4.679
+0.291
6.63%
1 ene 1997 año
5.846
+1.167
24.95%
1 ene 1998 año
5.185
-0.661
-11.3%
1 ene 1999 año
-0.577
-5.762
-111.12%
1 ene 2000 año
3.082
+3.659
-634.39%
1 ene 2001 año
4.411
+1.329
43.13%
1 ene 2002 año
2.894
-1.517
-34.39%
1 ene 2003 año
3.646
+0.752
25.98%
1 ene 2004 año
4.97
+1.324
36.33%
1 ene 2005 año
6.698
+1.727
34.75%
1 ene 2006 año
4.778
-1.92
-28.67%
1 ene 2007 año
5.243
+0.465
9.74%
1 ene 2008 año
6.617
+1.374
26.2%
1 ene 2009 año
4.153
-2.464
-37.24%
1 ene 2010 año
1.148
-3.004
-72.35%
1 ene 2011 año
7.632
+6.484
564.64%
1 ene 2012 año
3.66
-3.973
-52.05%
1 ene 2013 año
6.684
+3.024
82.63%
1 ene 2014 año
7.064
+0.38
5.69%
1 ene 2015 año
6.218
-0.846
-11.97%
1 ene 2016 año
5.905
-0.313
-5.04%
Ranking de los países por los datos estadísticos actuales


Comentarios: